I’ve spent countless hours watching live baseball games. It’s been central to a number of memorable moments:
A heated argument with a close friend outside of rainy Shea Stadium against the Cubs
Attending a game with someone I didn’t know well that led to over three hours of deep conversation
Game 4 of the 2015 World Series on Halloween Night
And many more.
I estimate attending more than two-hundred major and minor league baseball games in my lifetime. Throughout the years I’ve kept as many physical ticket stubs as I possibly could, an anachronism now with all MLB teams offering only digital tickets.
With all these physical tickets I started to think about how to catalogue their data to quantify my attendance. Tickets over the past twenty years have changed dramatically. Many of the early tickets I had in my possession were woefully utilitarian, stating the bare minimum details needed to know who was playing and where to sit. Many of these tickets were cheap seats—the face value of one of my tickets is $2! As I attended more games over time, I slowly collected tickets with better aesthetics and more creativity. The evolution of my ticket collection was fun to watch.
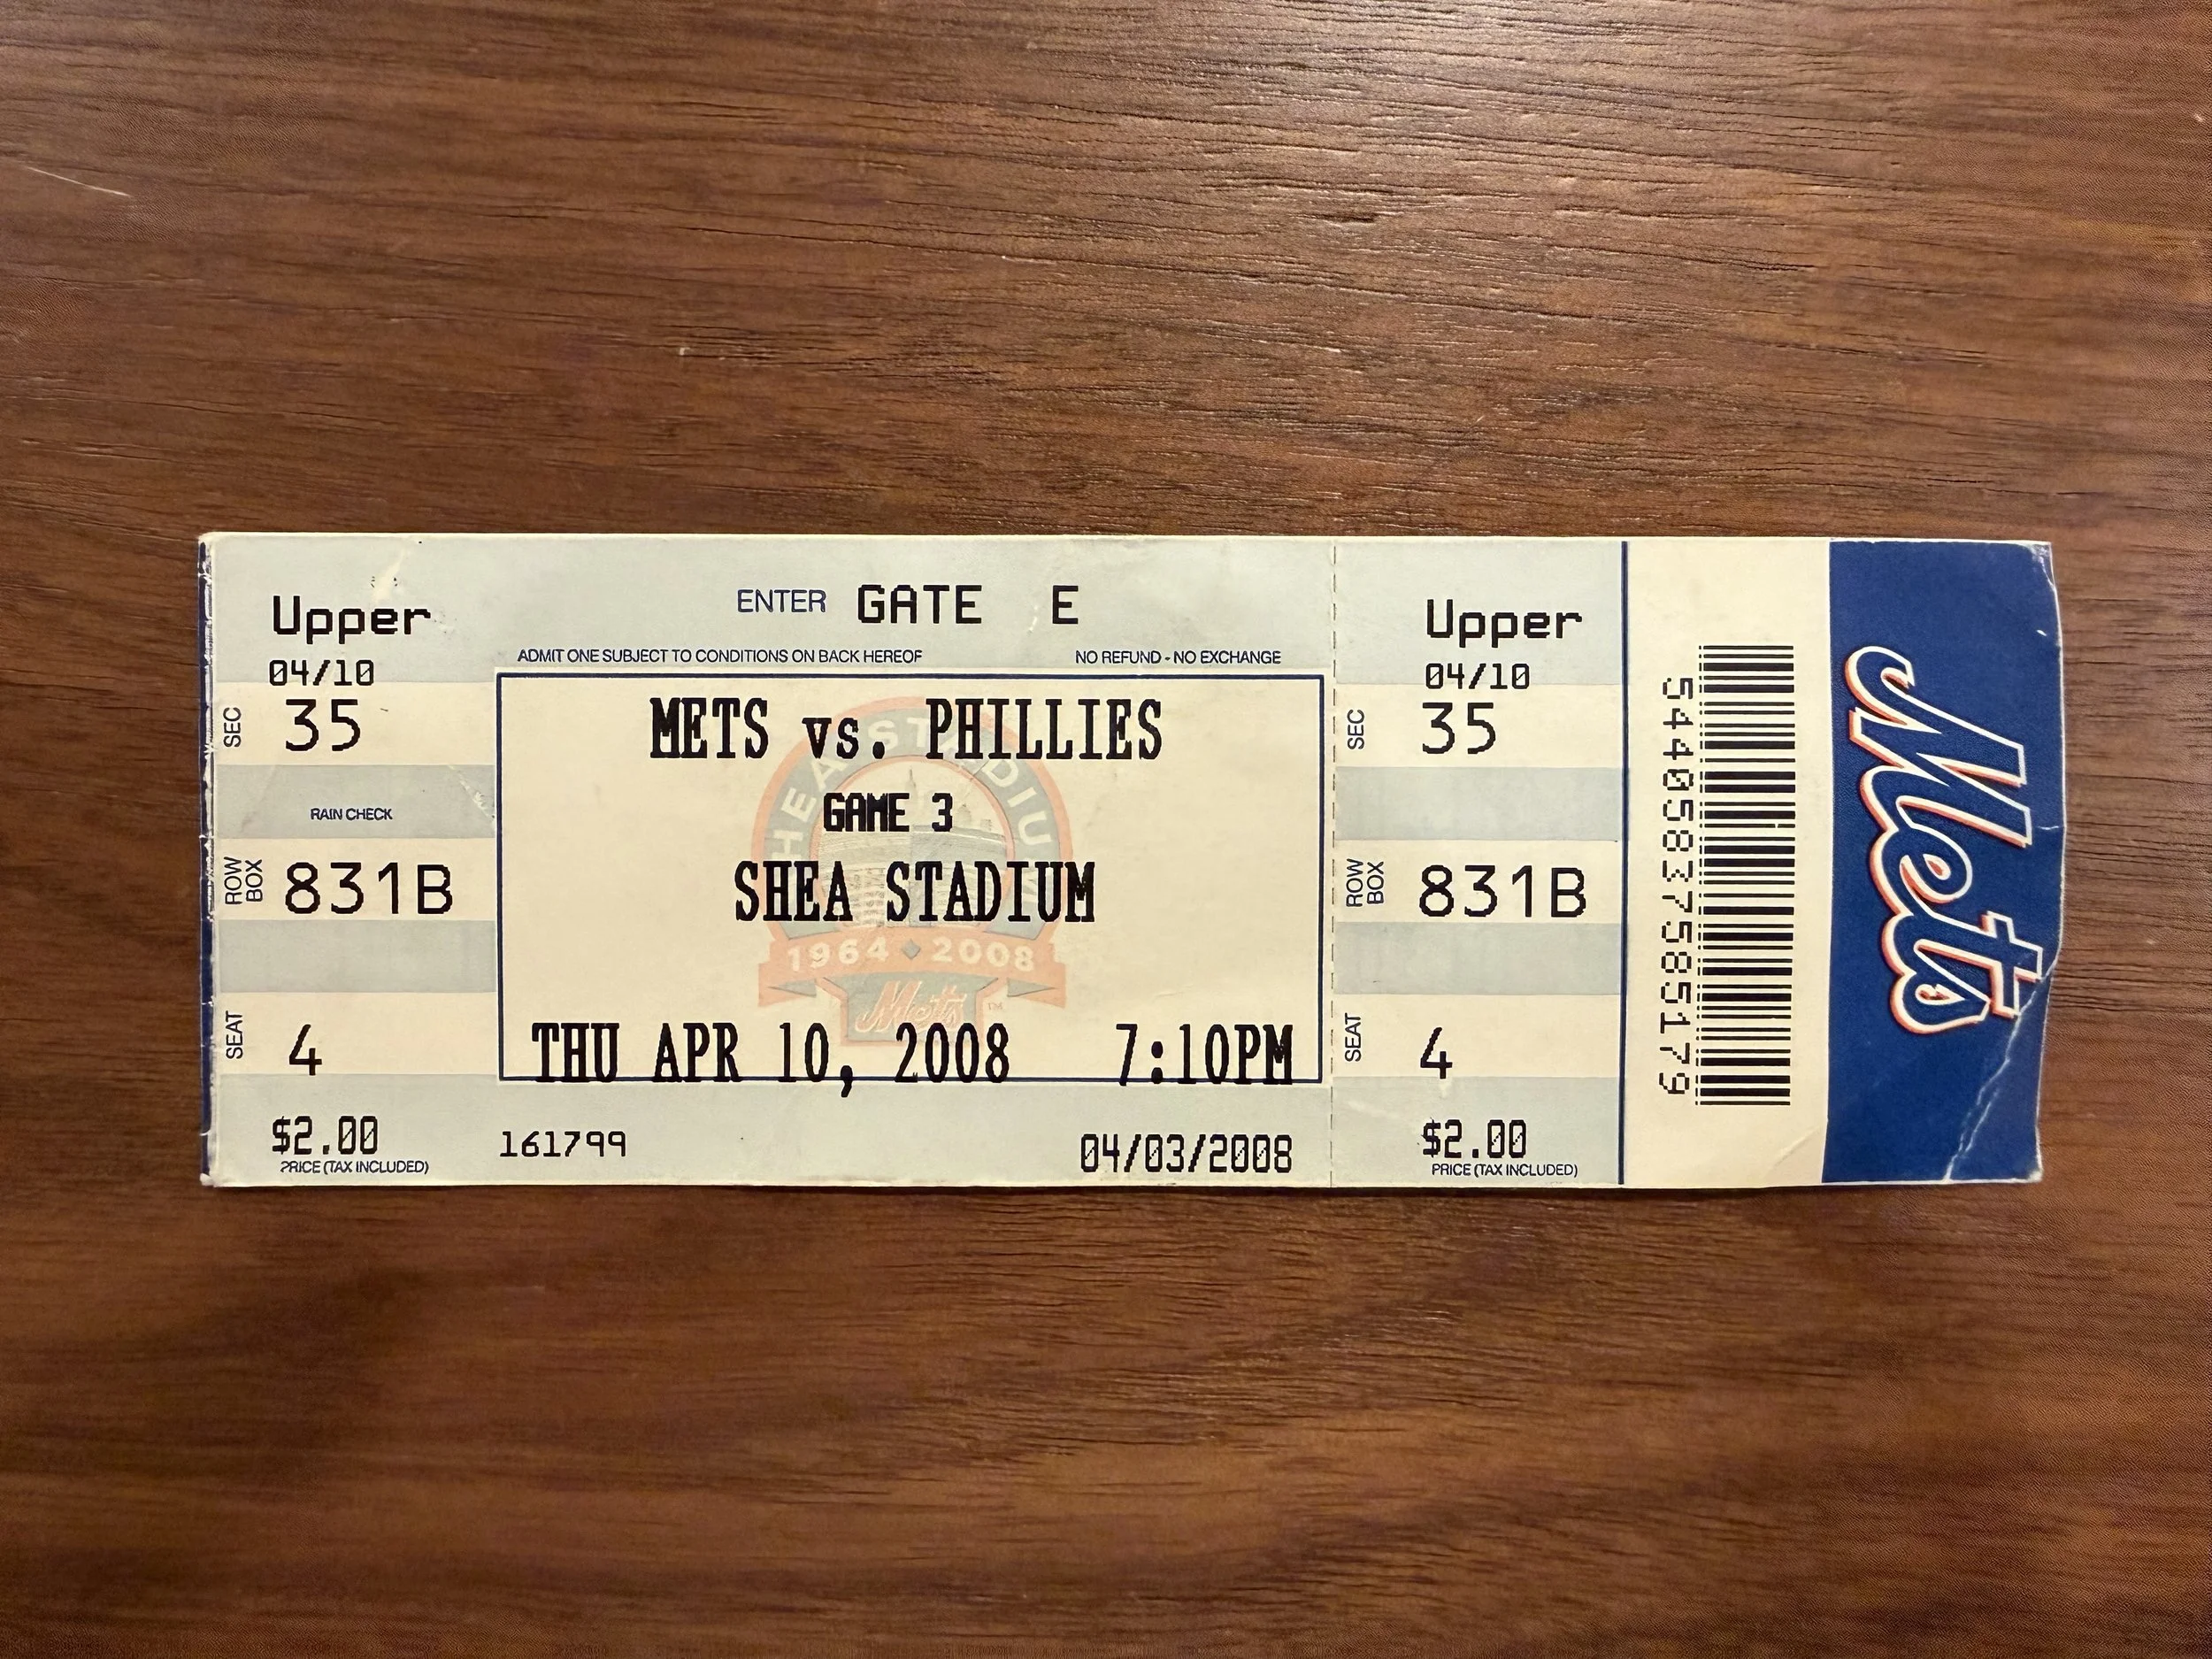
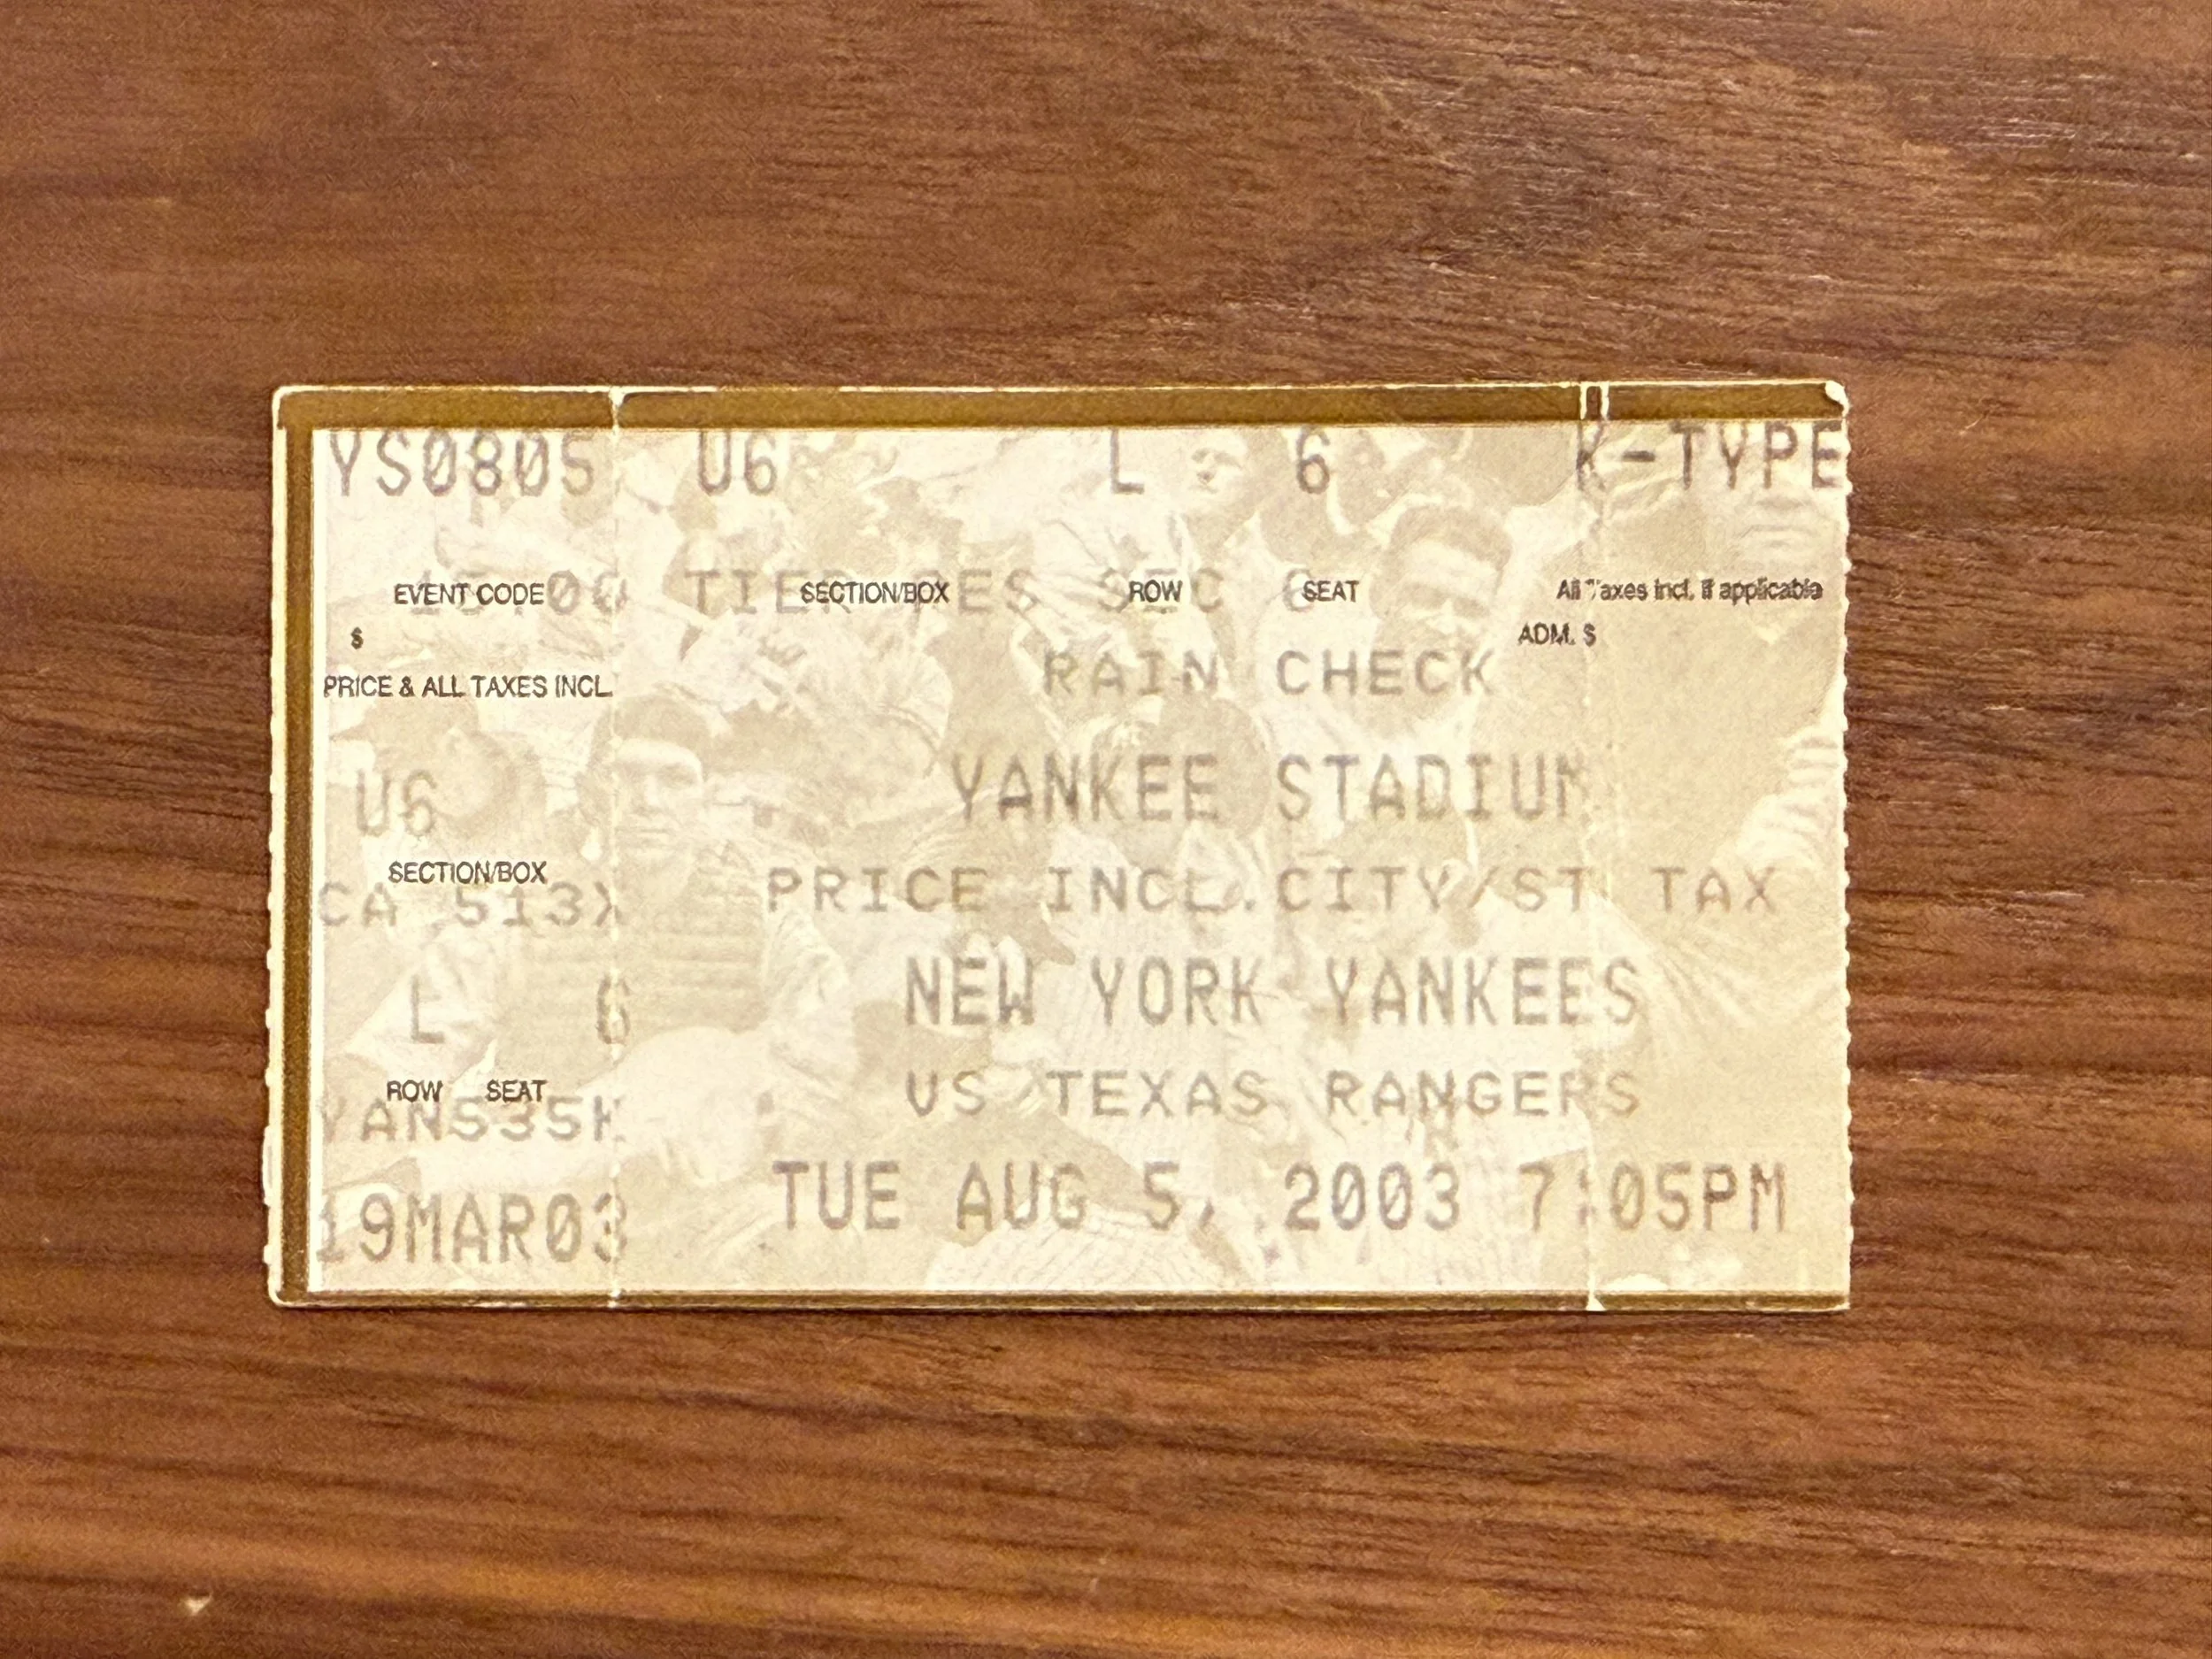
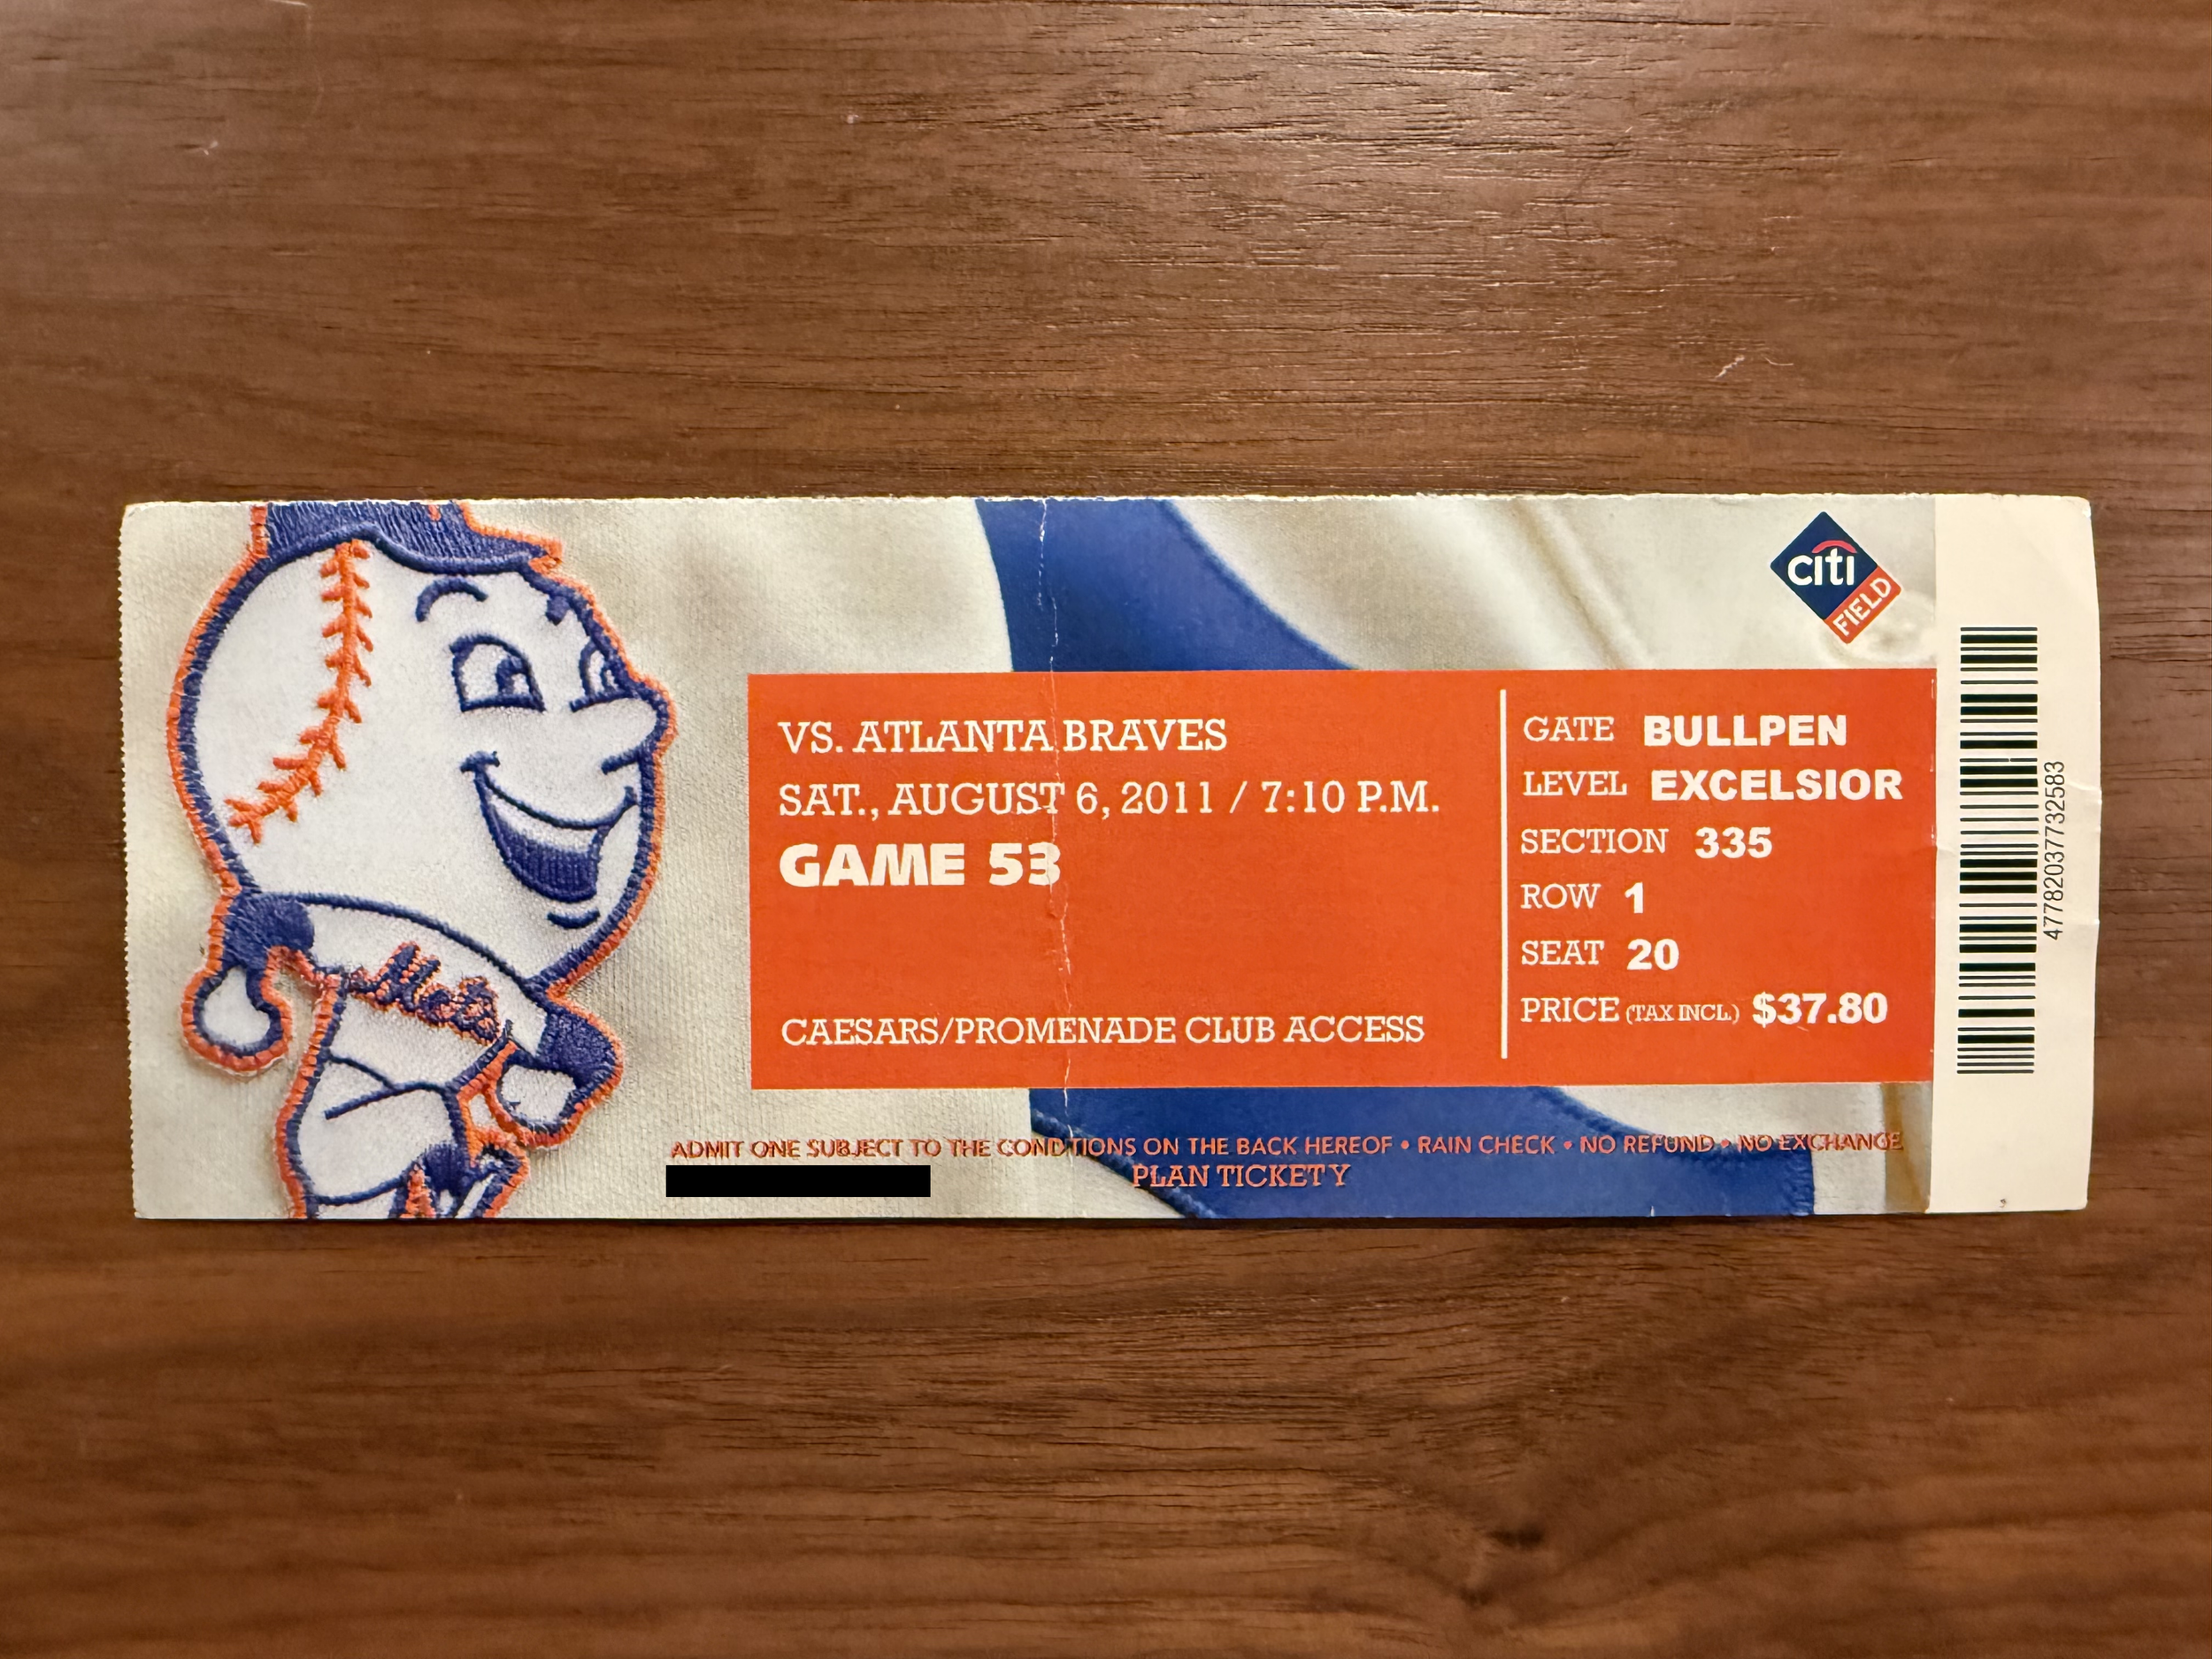
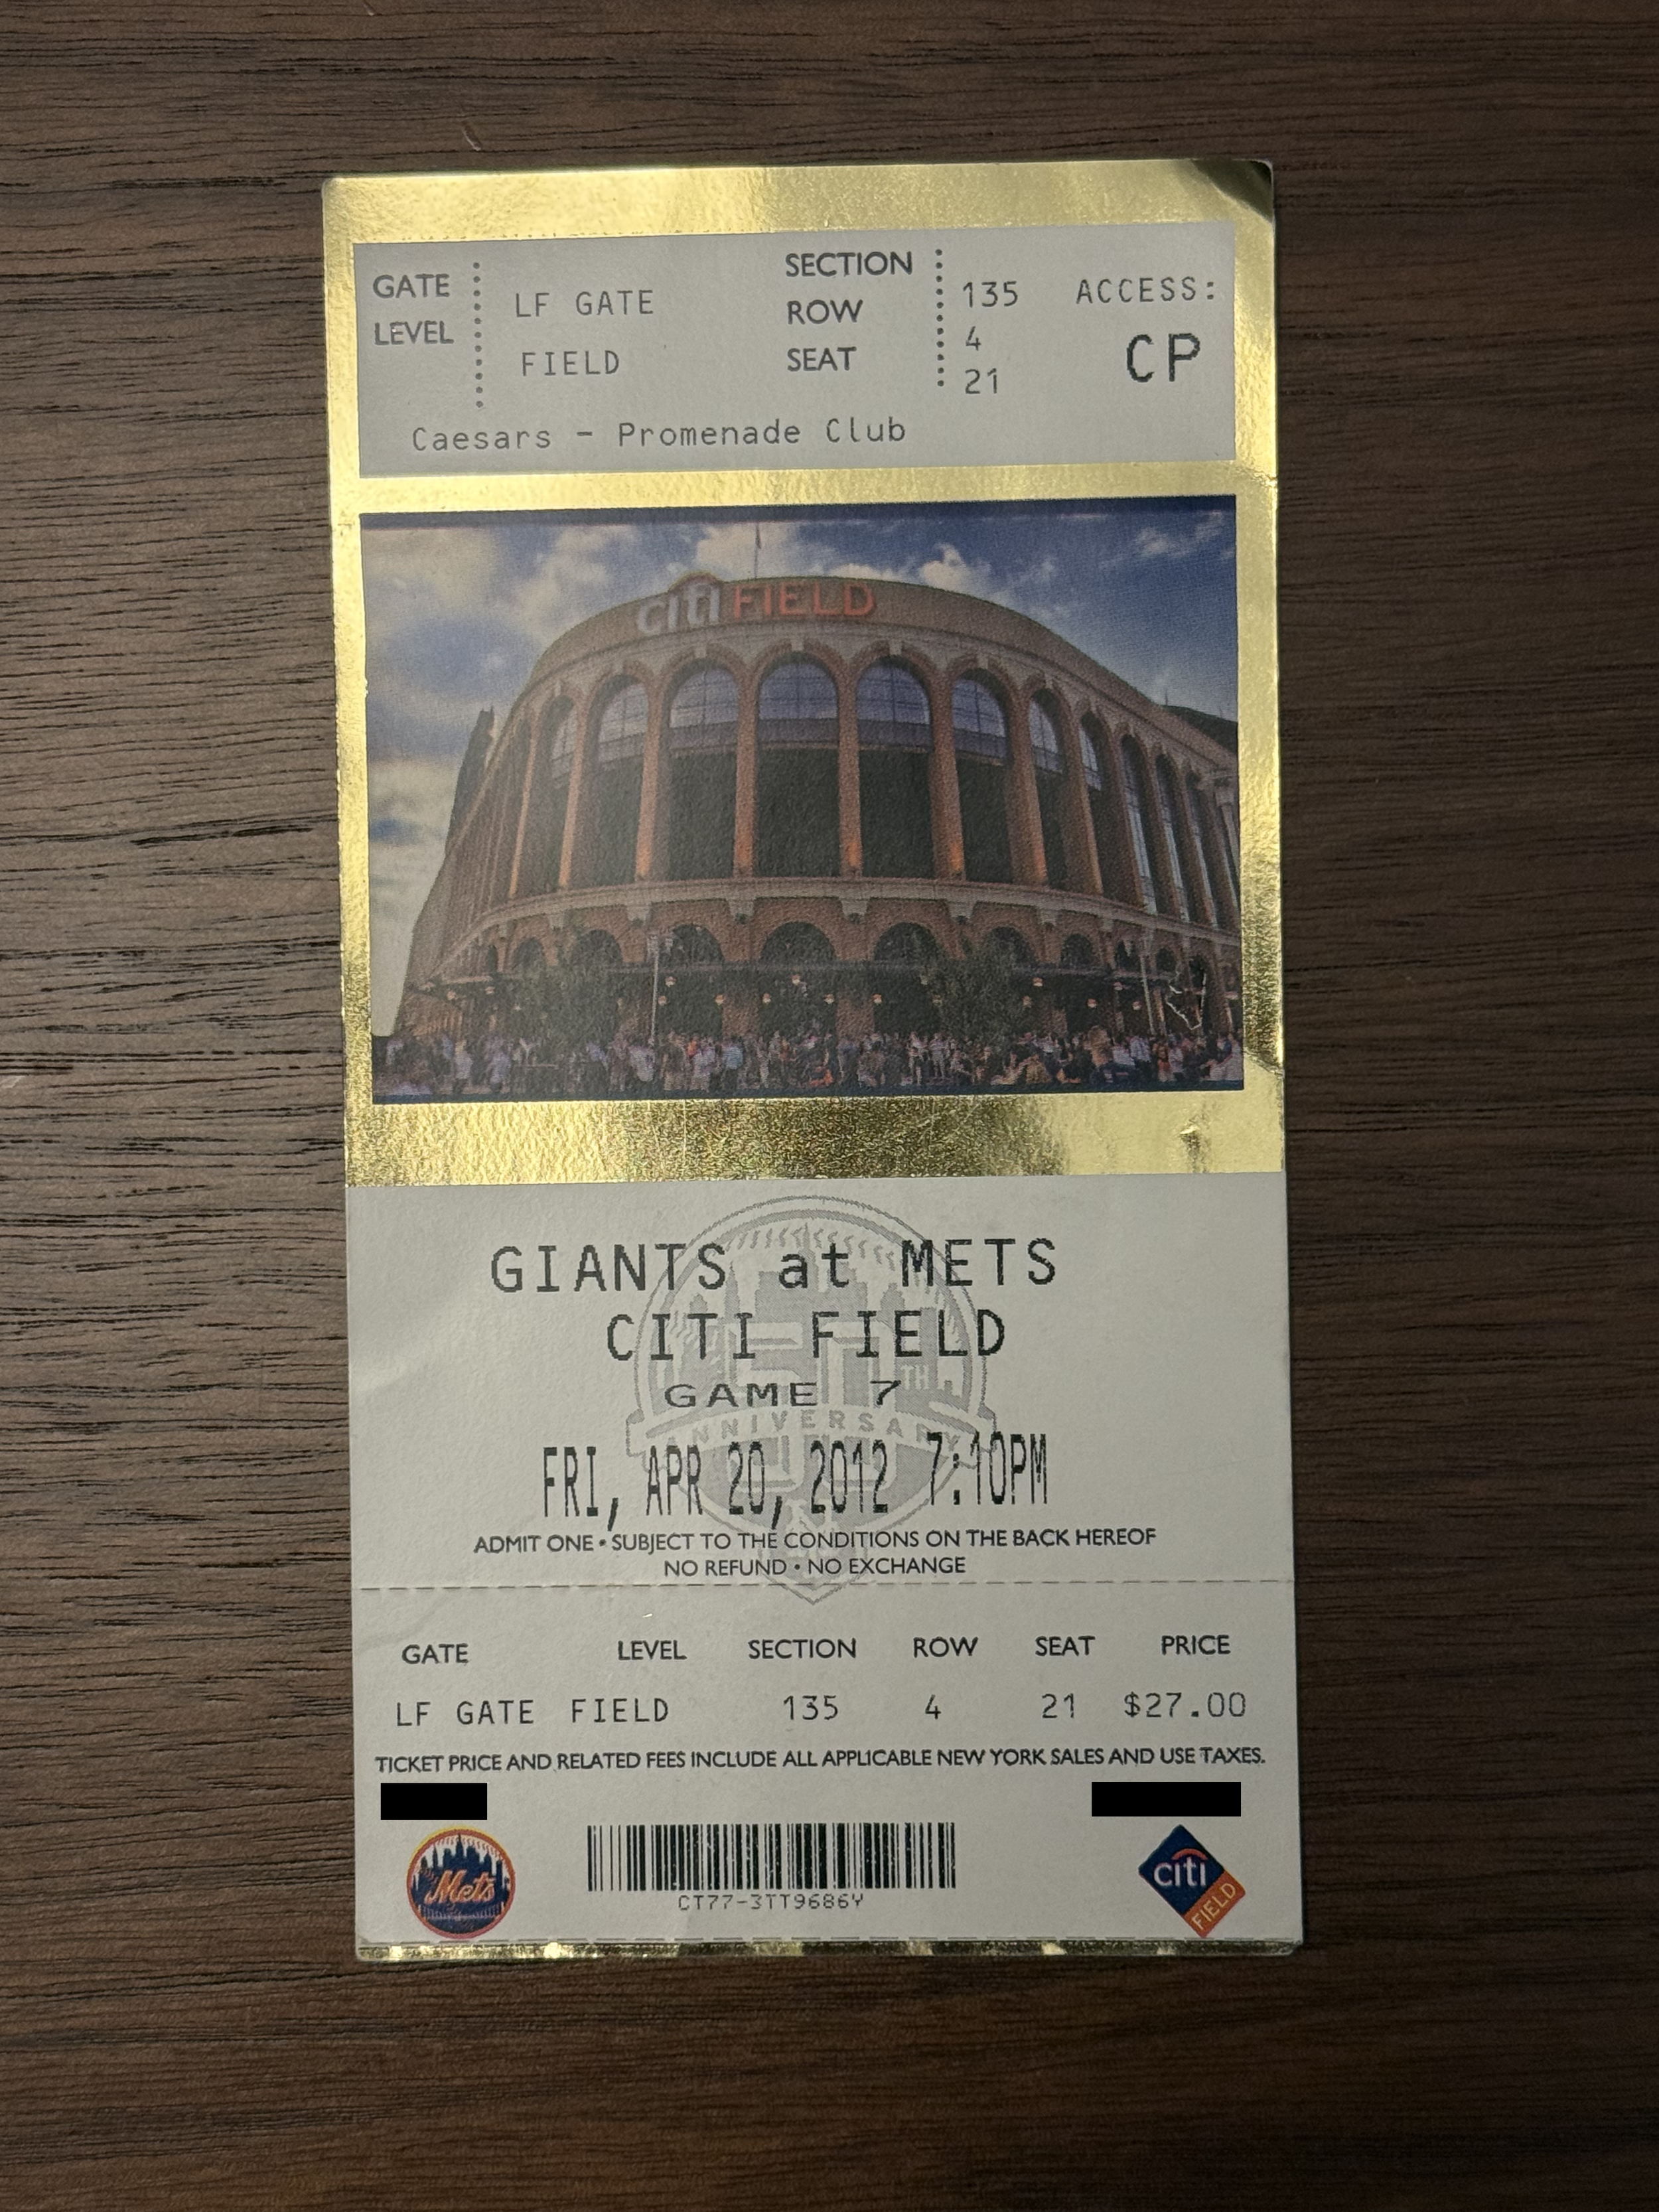
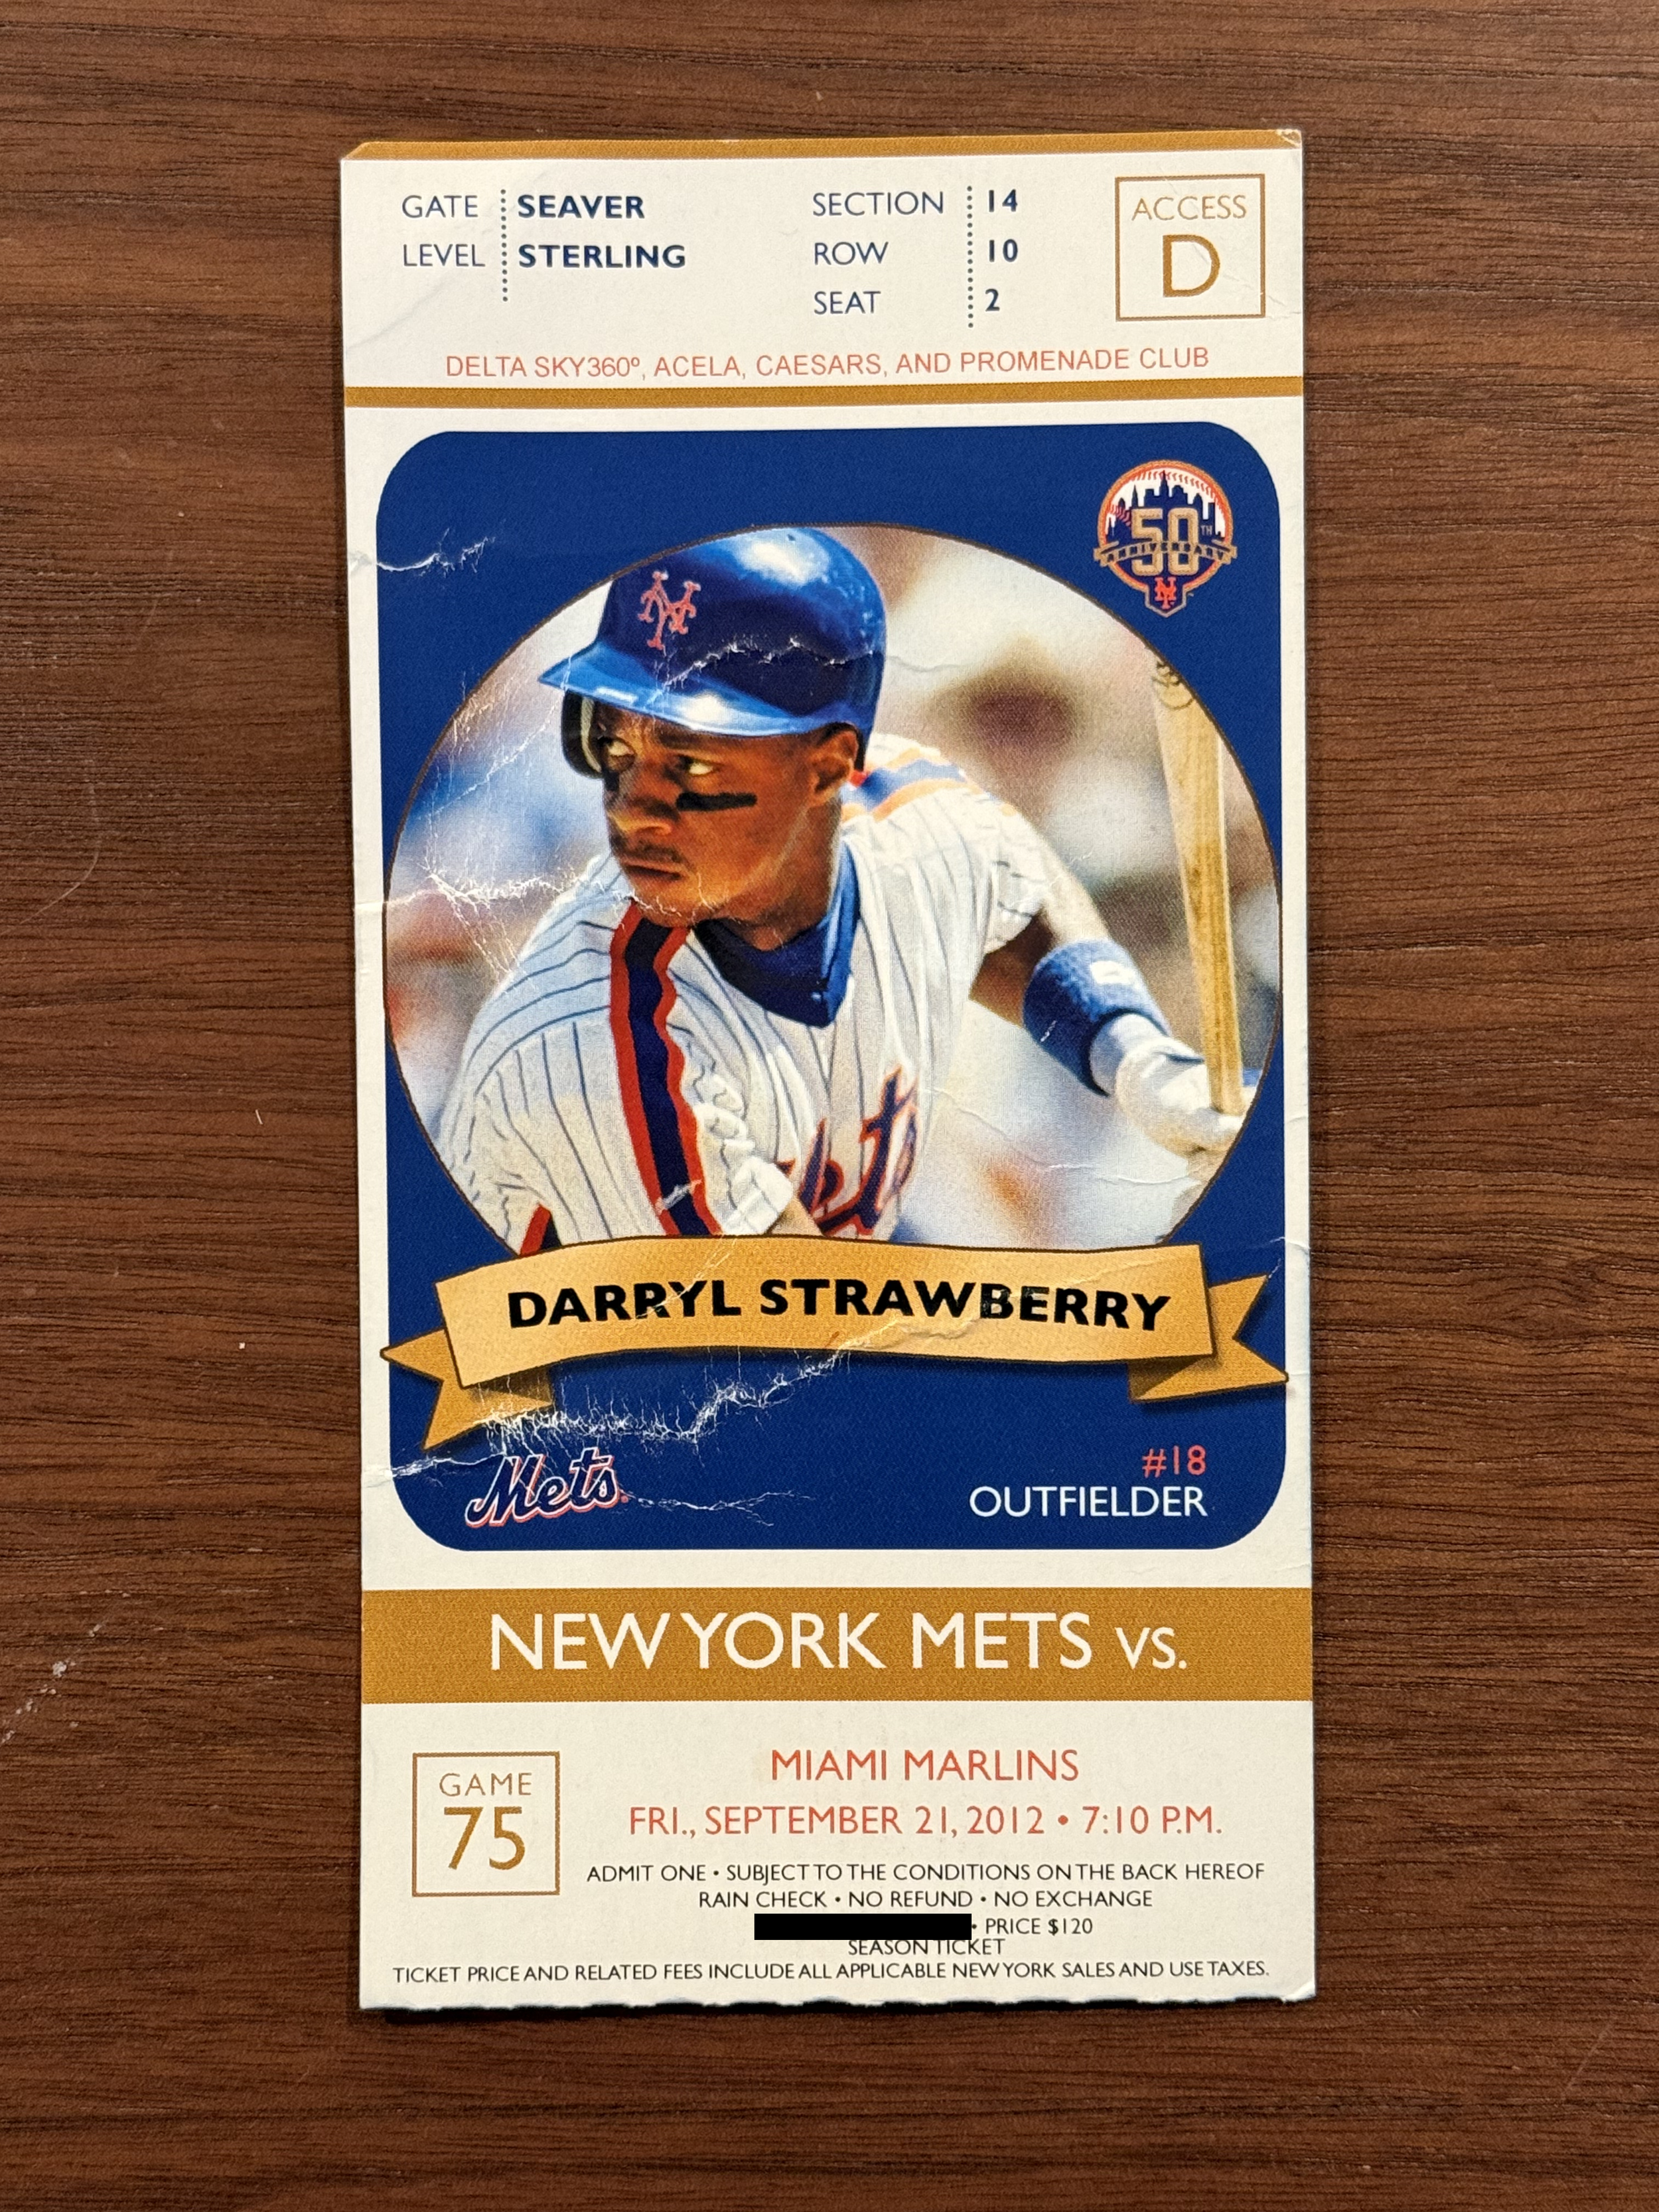
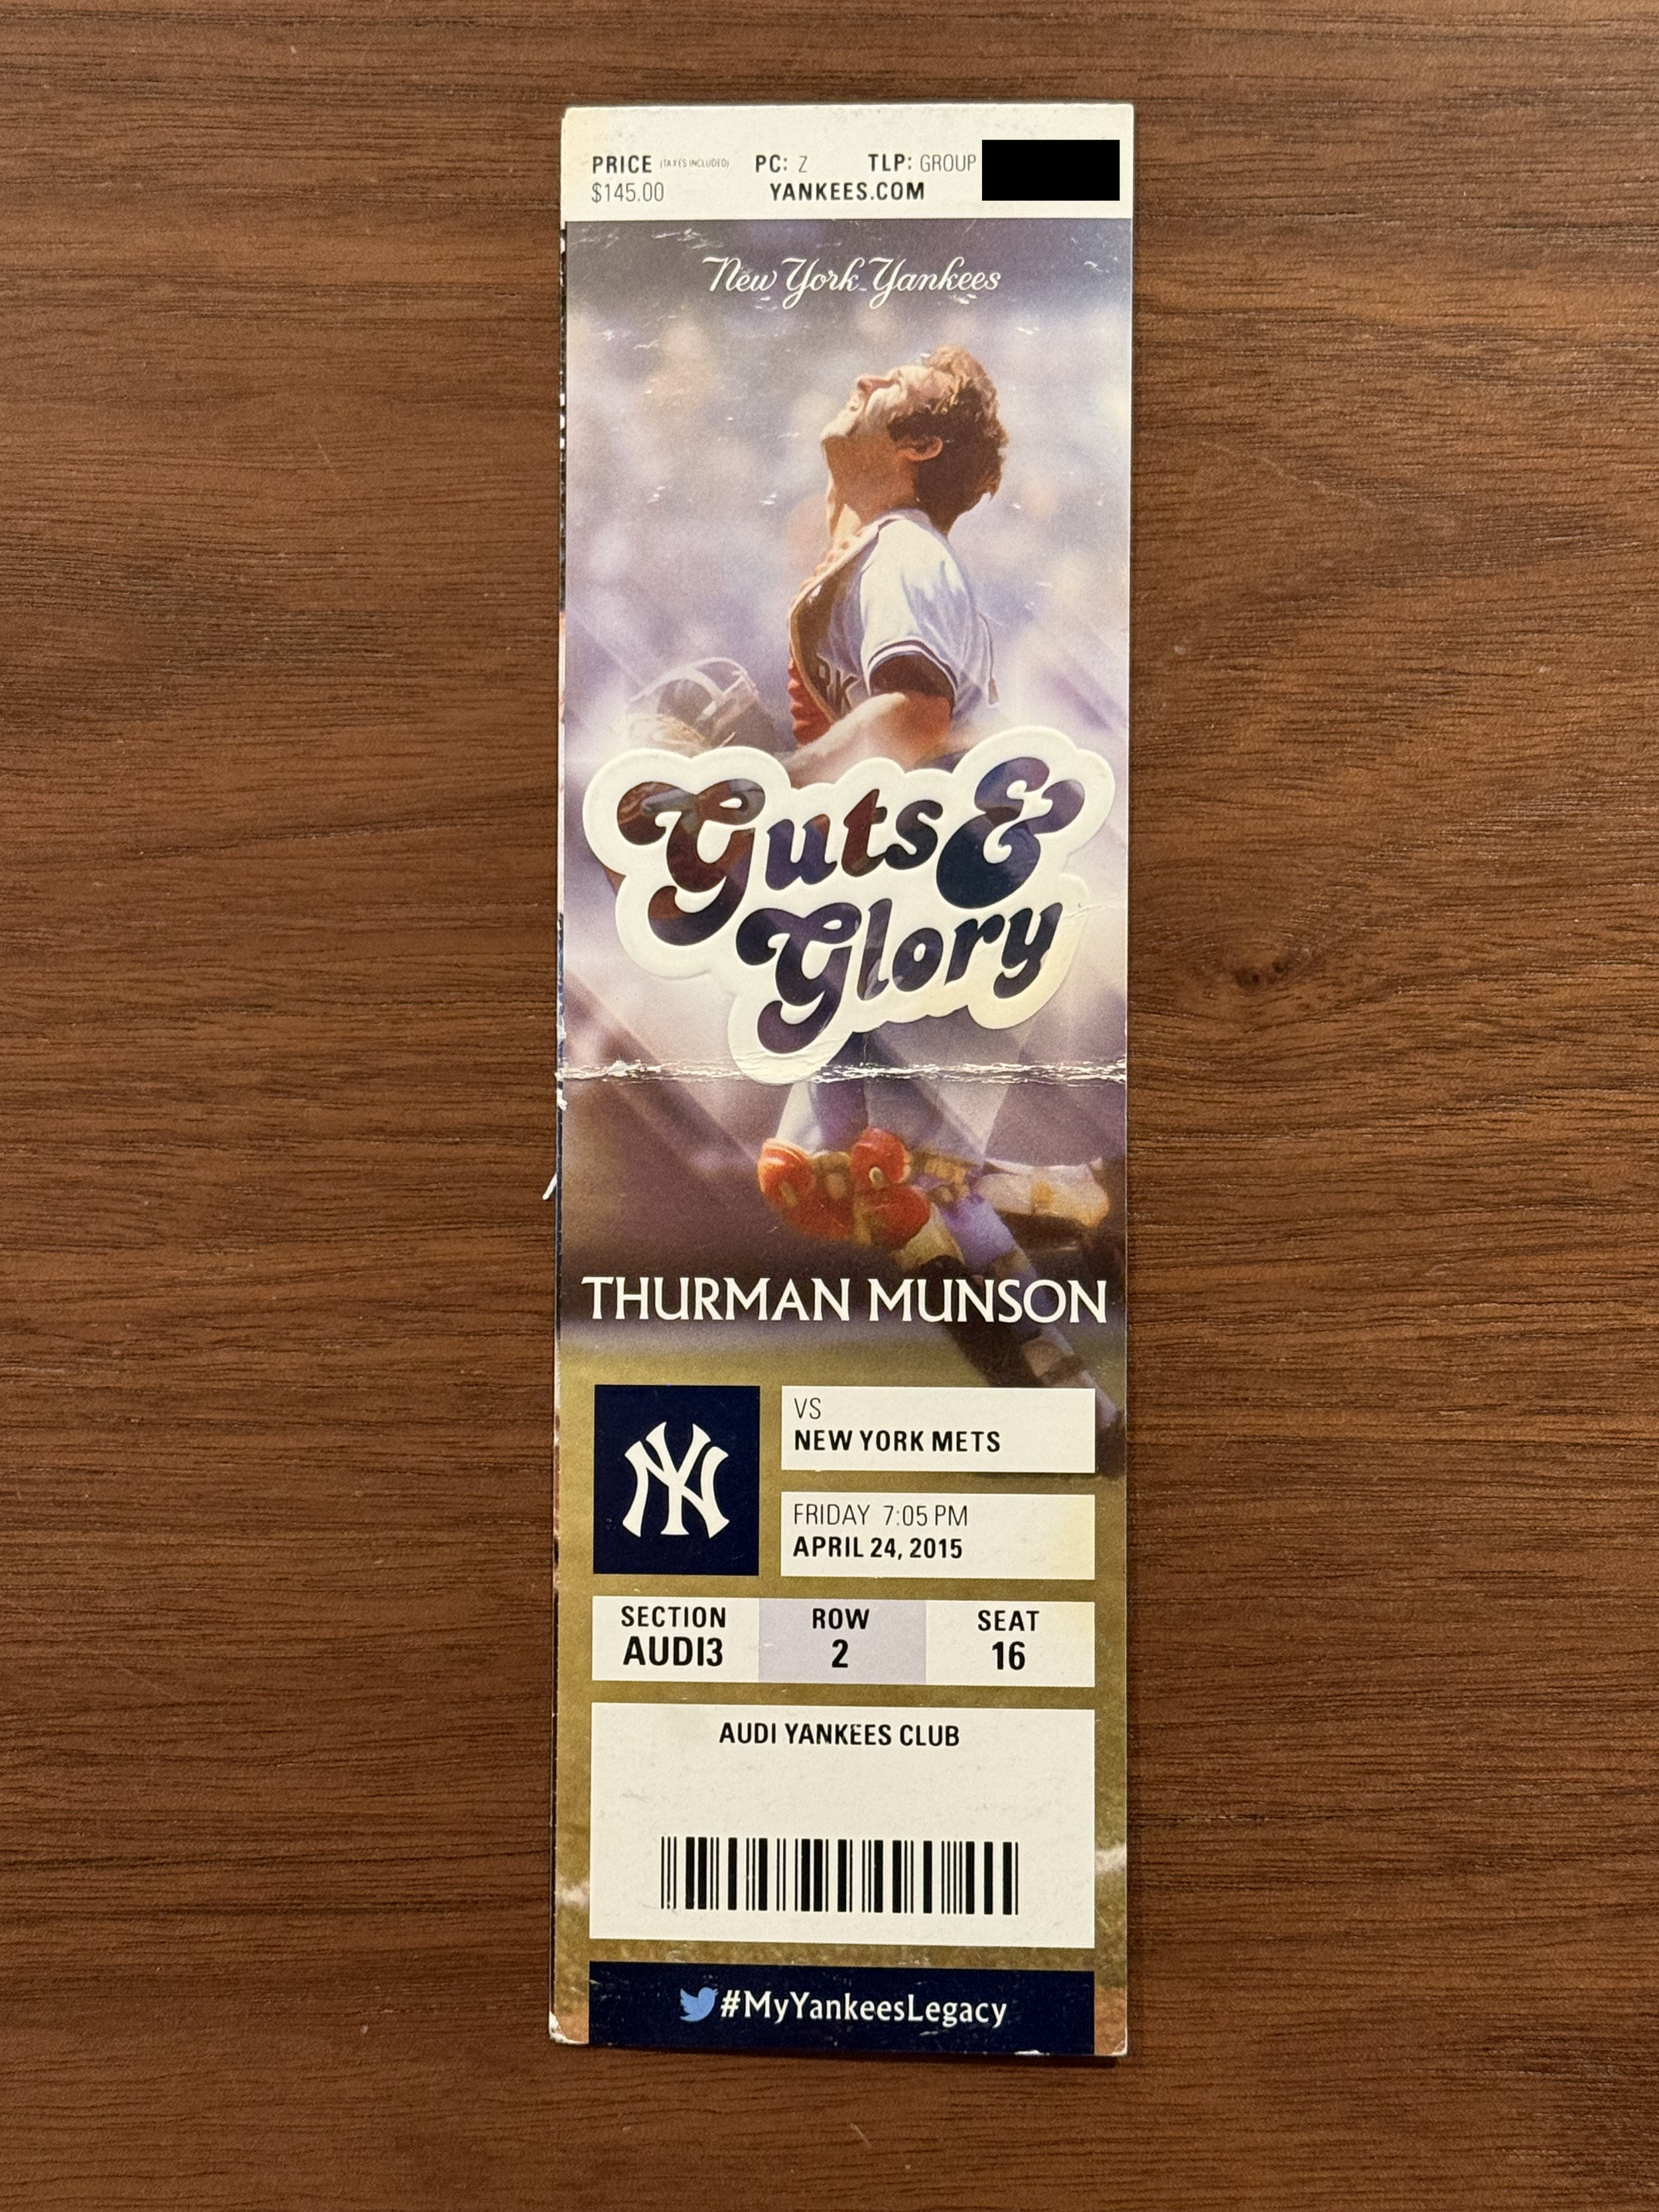
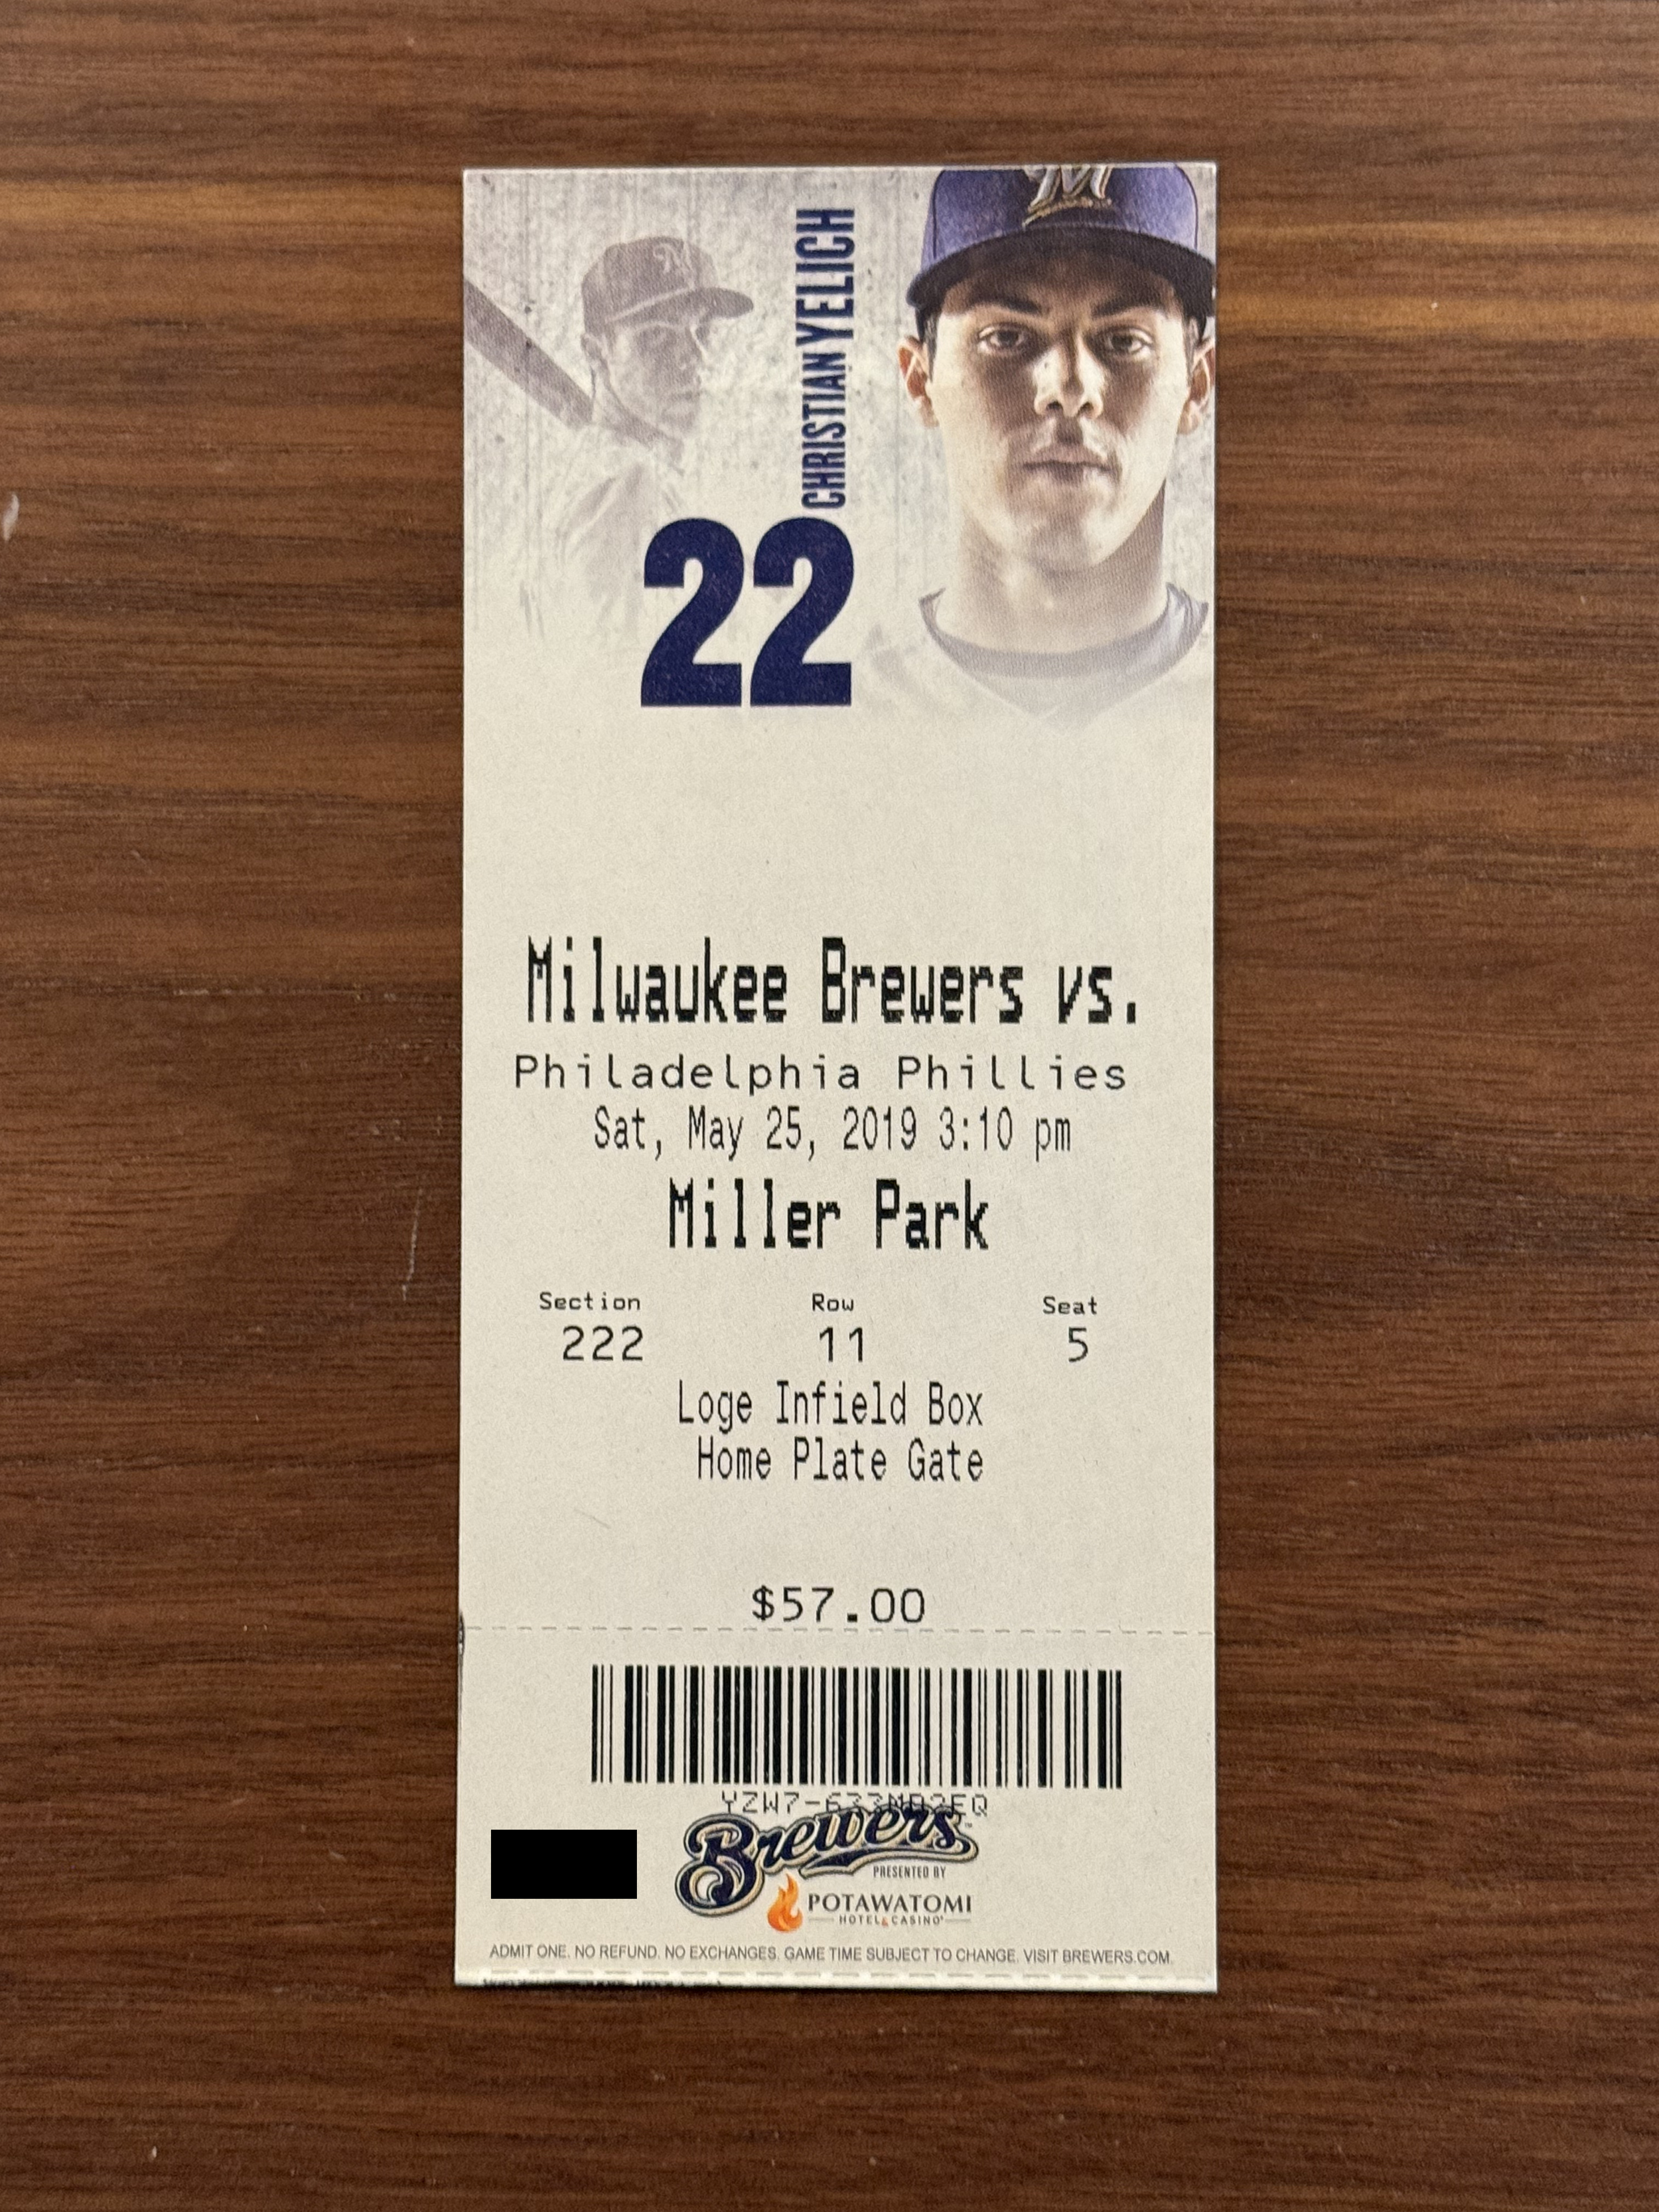
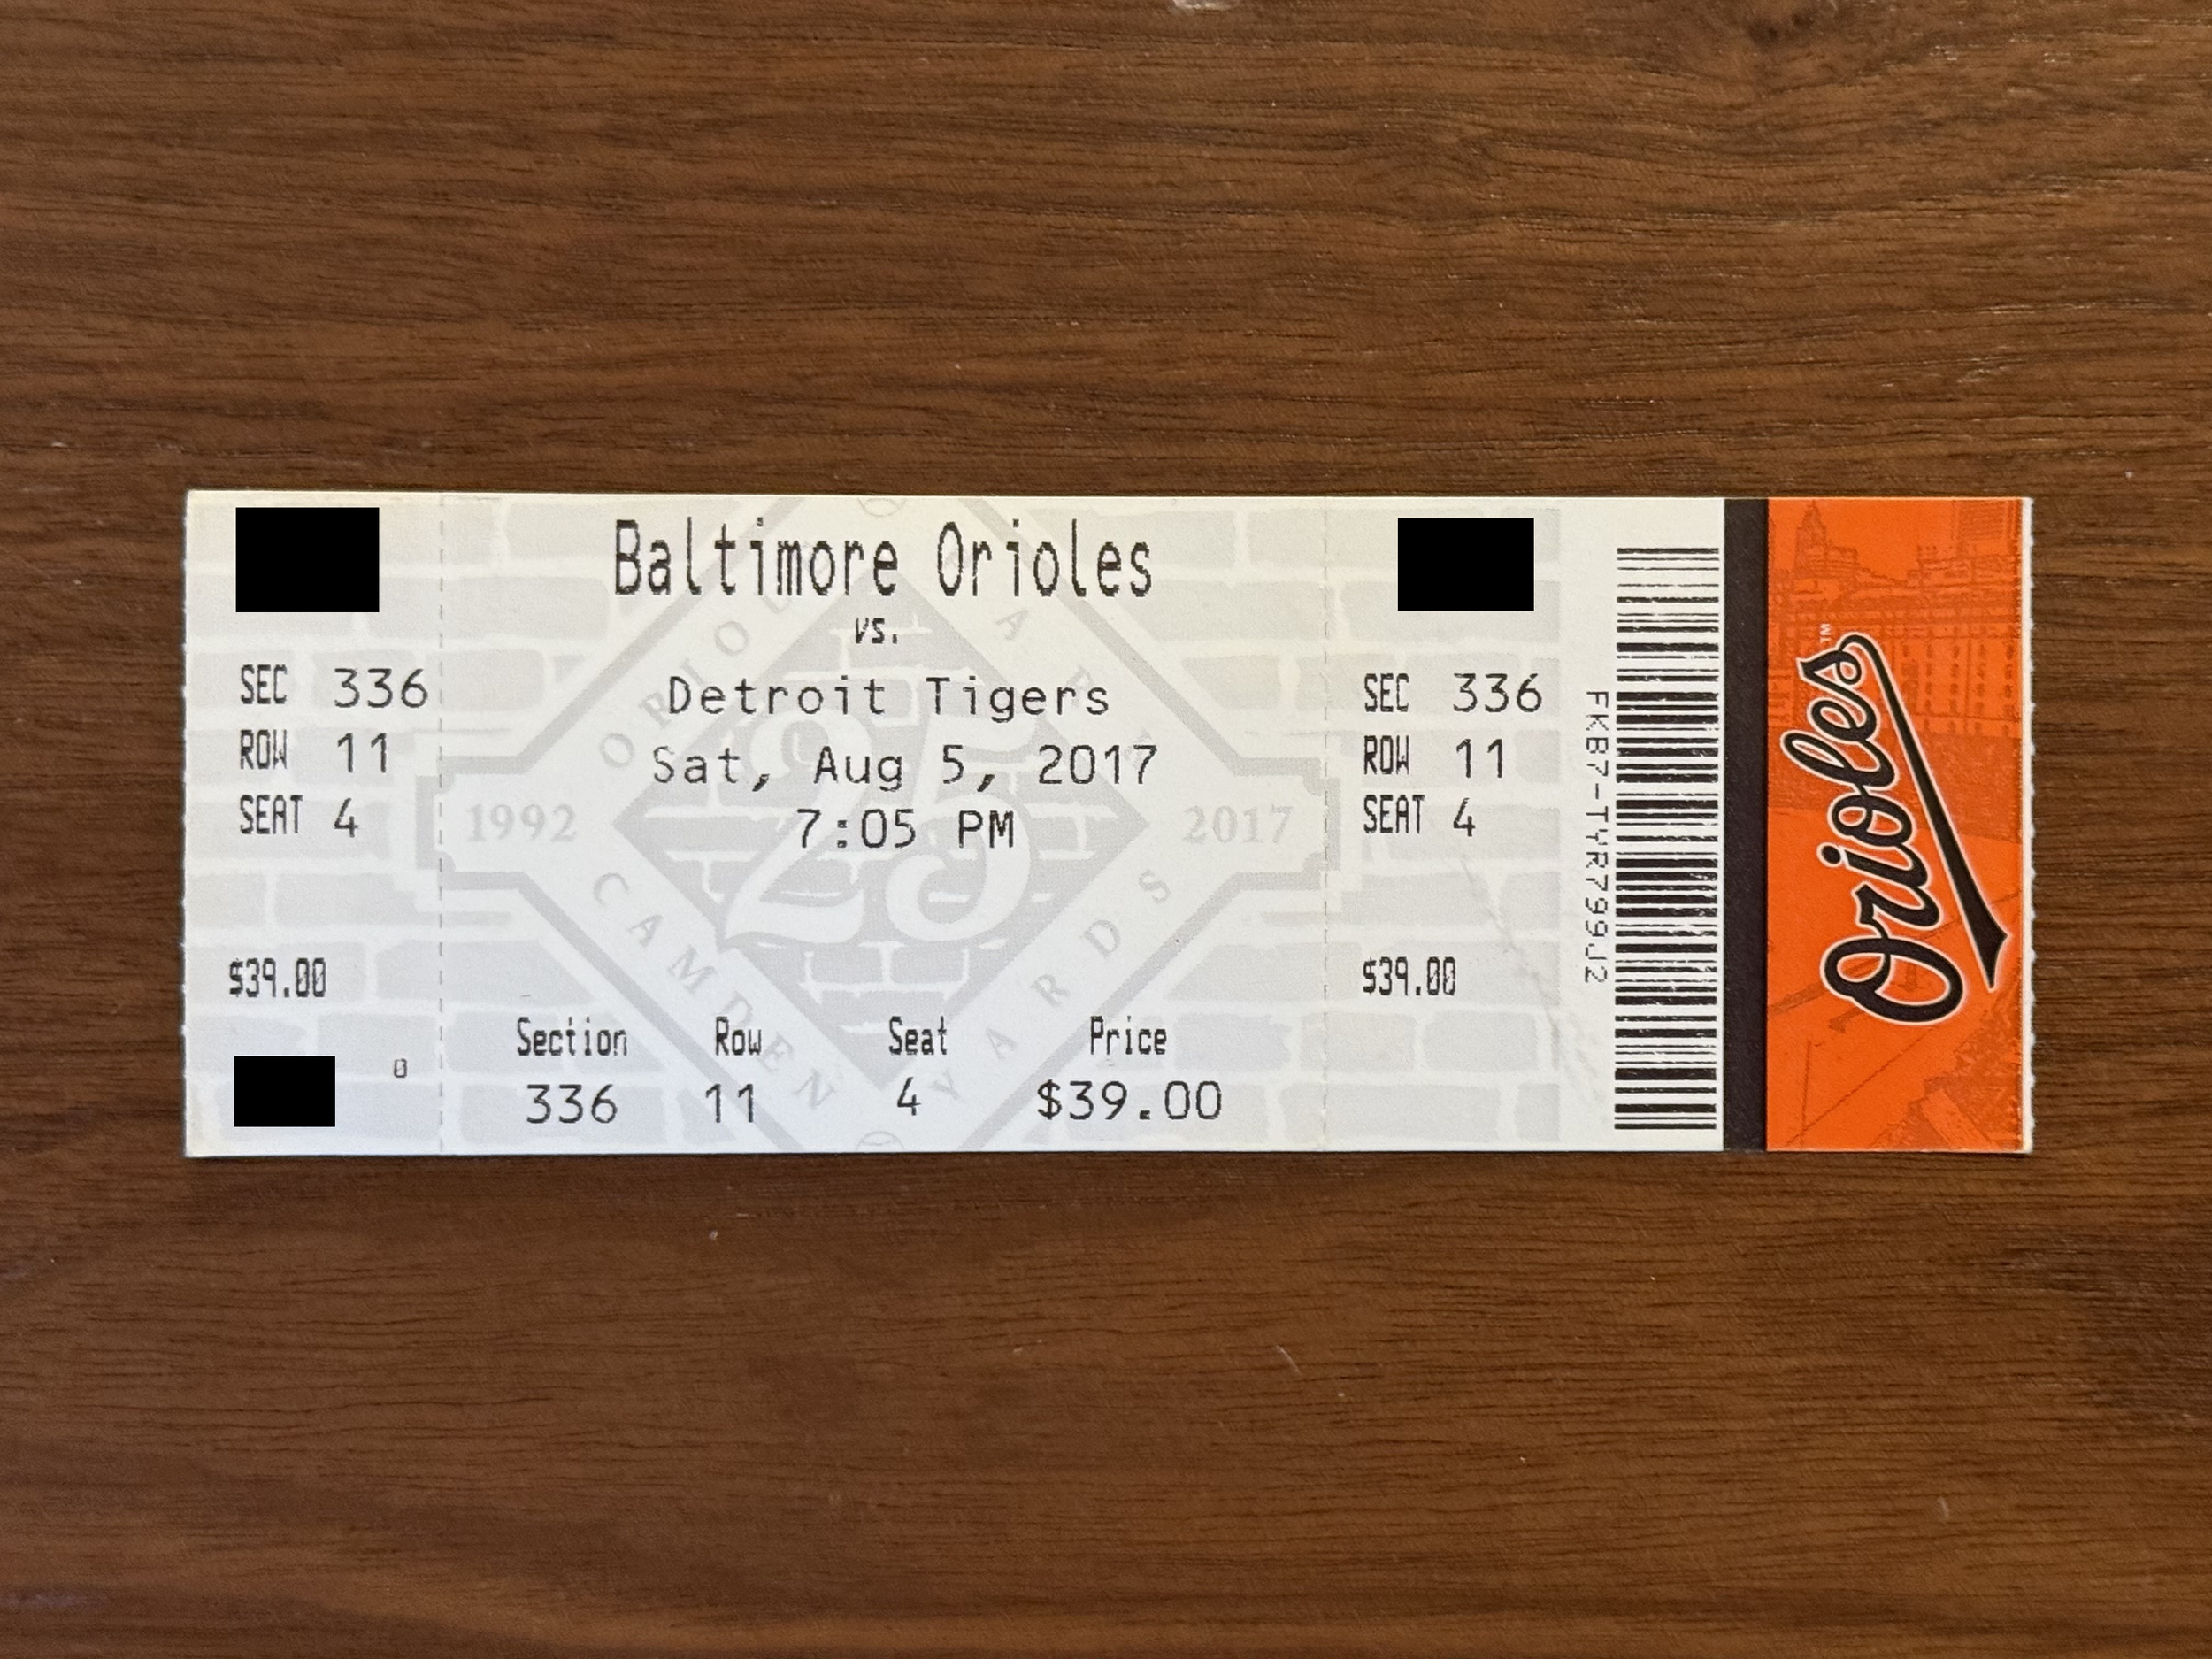
Initially I began manually entering ticket data into a spreadsheet. It had been years since I held the physical tickets and many were reminders of important moments like the ones I mentioned earlier. While I enjoyed handling the tickets and studying the minutiae of each (including all the Subway sandwiches I never received discounts on) it was mind numbing.
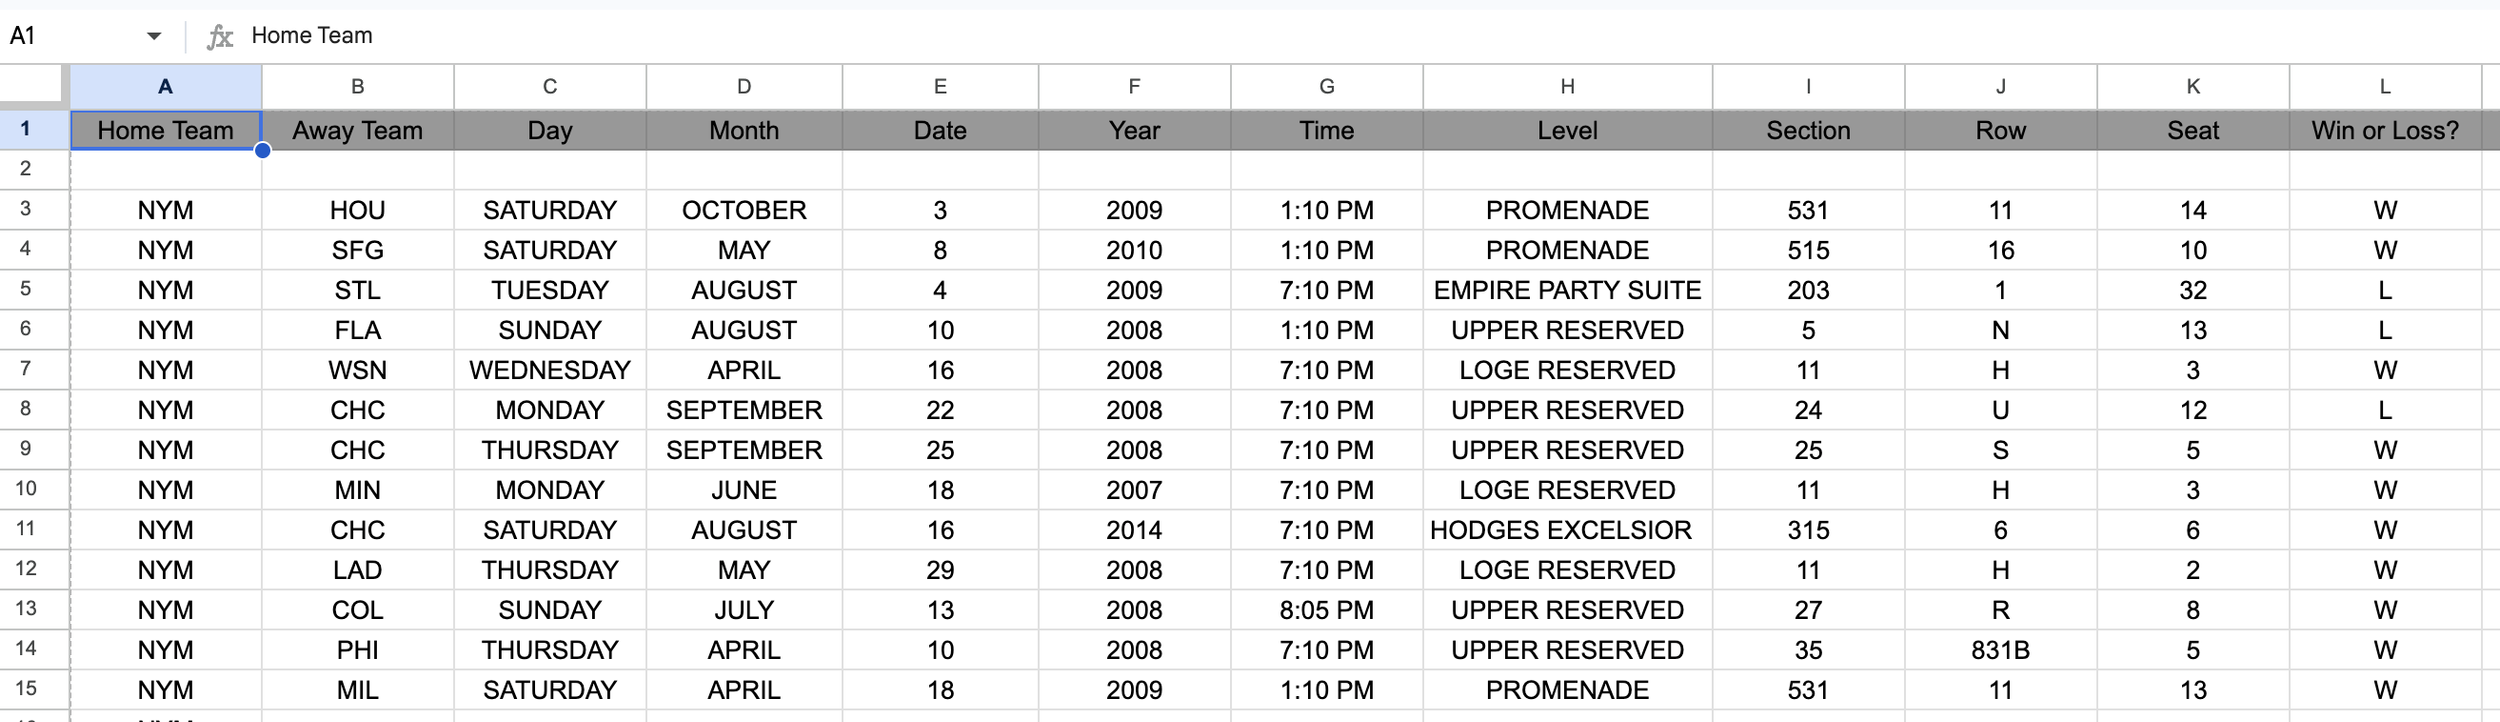
To expedite this, I turned to Claude to analyze images of each ticket.
I took pictures of all one-hundred twenty-eight physical tickets and wrote a Python script to extract ticket data elements using Claude’s vision API and add it to an Excel file. Each row in the spreadsheet was tagged with confidence scores. Anything flagged as Medium or Low confidence I prioritized manual reviews for accuracy.
The Ticket Data
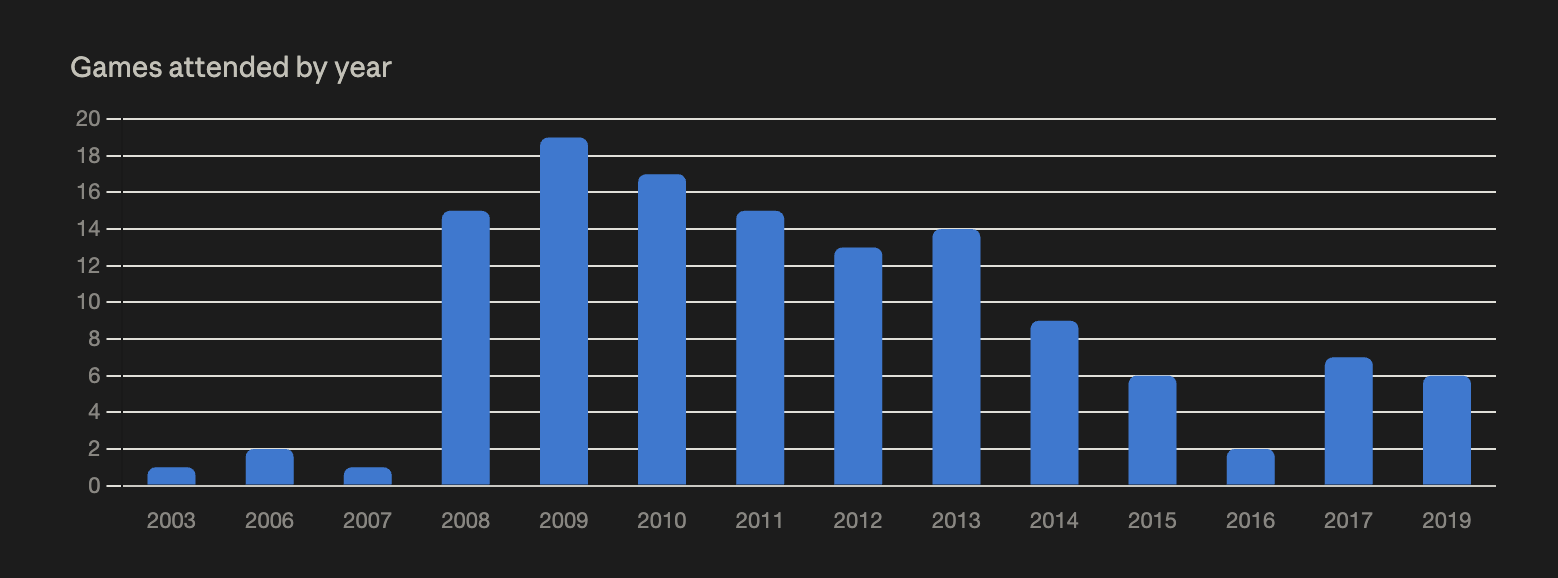
I attended one-hundred twenty games between 2003-2019. The remaining eight tickets were secondary tickets for friends and family to games already in the ledger. The average ticket face value over this time span was $51. The bulk of games attended started in 2009 when I purchased partial ticket plans that coincided with the Mets Citi Field opening.
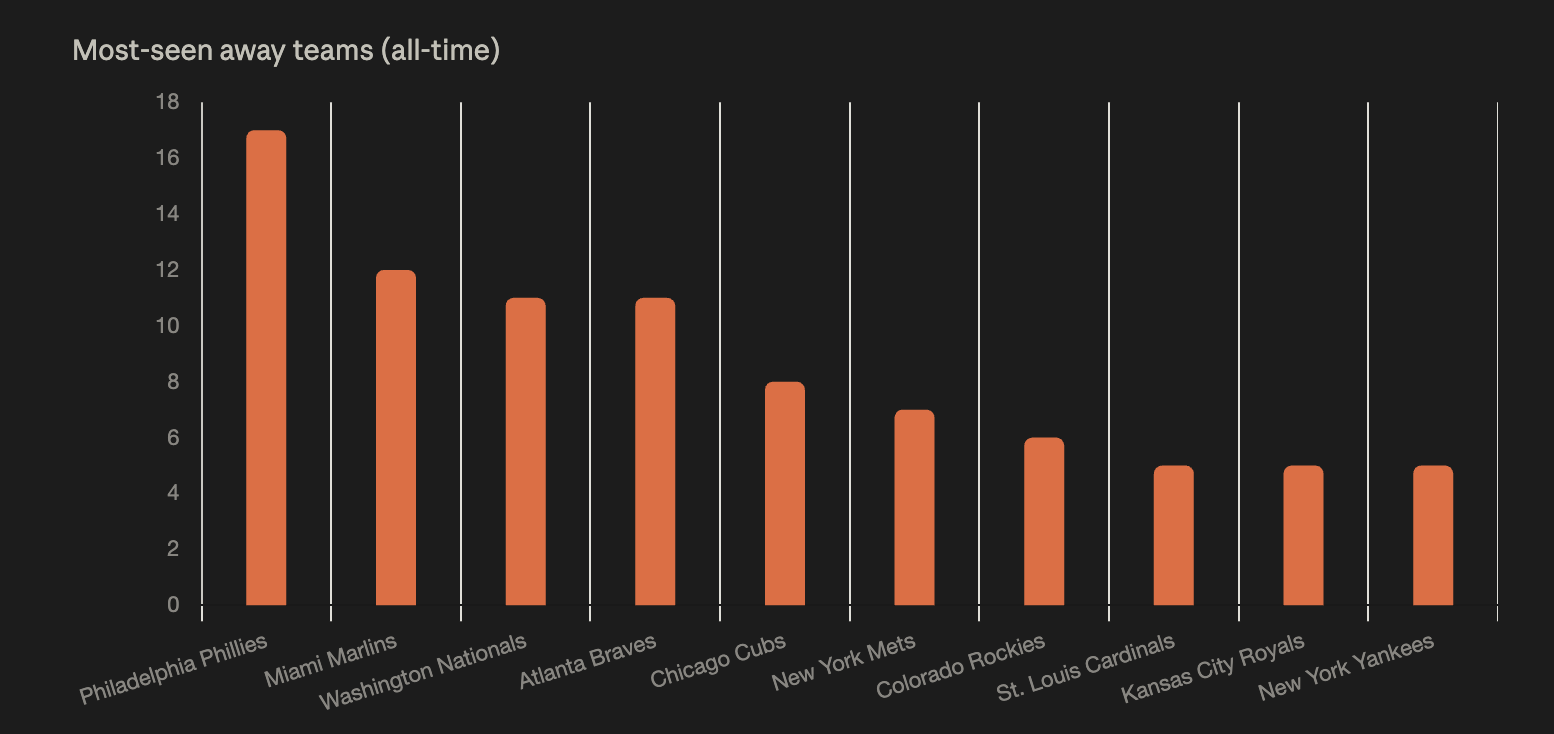
Since ninety-eight of these games were Mets home games, matchups against the National League East clearly dominate. I can’t believe I’ve seen the Phillies so much in my life. I attended twenty-two Yankees home games during this span as well, which is why the Mets are the sixth most watched road team on the list.
Ballparks Visited
Yankee Stadium (old and new)
Miller Park (Now American Family Field)
The Script
I had a number of learnings after the initial v1 script run:
It didn’t have strong hallucination guardrails and the result confidence skewed higher than it should have. Approximately 48% of the rows were marked as “high” confidence.

This made me realize that I was actually asking Claude to judge its own model accuracy instead of ensuring field level confidence. To help I introduced a stronger anti-hallucination prompt and field level confidence requirements. The script didn’t validate the schema or data type—it returned valid JSON but it wasn't actually checking if the values were the expected ones (date, time, etc.). I introduced Pydantic to check for allowed values, date formats, and confirm the returned values were predictable.
I took photos of all ticket stubs using an iPhone, which defaults to HEIC format. In order for the script to process the images correctly I needed to convert them using pillow-heif.
One quality of life addition I introduced in v2 was extracting all raw text from the ticket stub into the spreadsheet even if it didn’t match the expected schema.
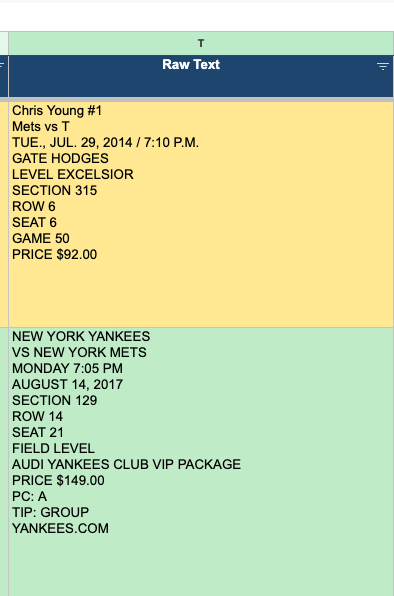
In the event field mapping failed for any reason, I have the data available to me without having to process images again. This helped with manual validation.
Data Validation
I manually validated each row in the spreadsheet after the v1 script run, starting with low and medium confidence findings first before finalizing the “high” confidence findings. I could have sampled a random portion of the results and fed them back into the process to calculate error rates or identify patterns, but this was an intentional decision. I wanted to perform a personal deep dive of the ticket information in the same way I studied the physical tickets. Anything more complex would be left to future script iterations.
Some observations from validating the preliminary data:
Claude misread a number of teams and dates for most medium confidence findings, the bulk of these errors occurring when ticket images were incorrectly oriented (sideways or upside down). Even high confidence findings still had errors, although many were limited to one or two data elements.
Surprisingly, several rows listed the Chicago Cubs and Wrigley Field as the de facto home team and stadium, respectively. I suspect this is because Claude attempted to infer the home and stadium using its own baseball knowledge. There are several games I attended with teams that have similar looking “C” logos




I did not explicitly instruct Claude to not use its baseball knowledge or refrain from guessing in the v1 script so it clearly hallucinated, even for of games where there was no logo similarity of any kind.
Each MLB team has eighty-one home games. Not all teams note which home game you’re attending during the season but the Mets do. Identifying home games I attended for other teams required additional research.
Expansion
Here’s a two game sample after implementing the changes I mentioned before.
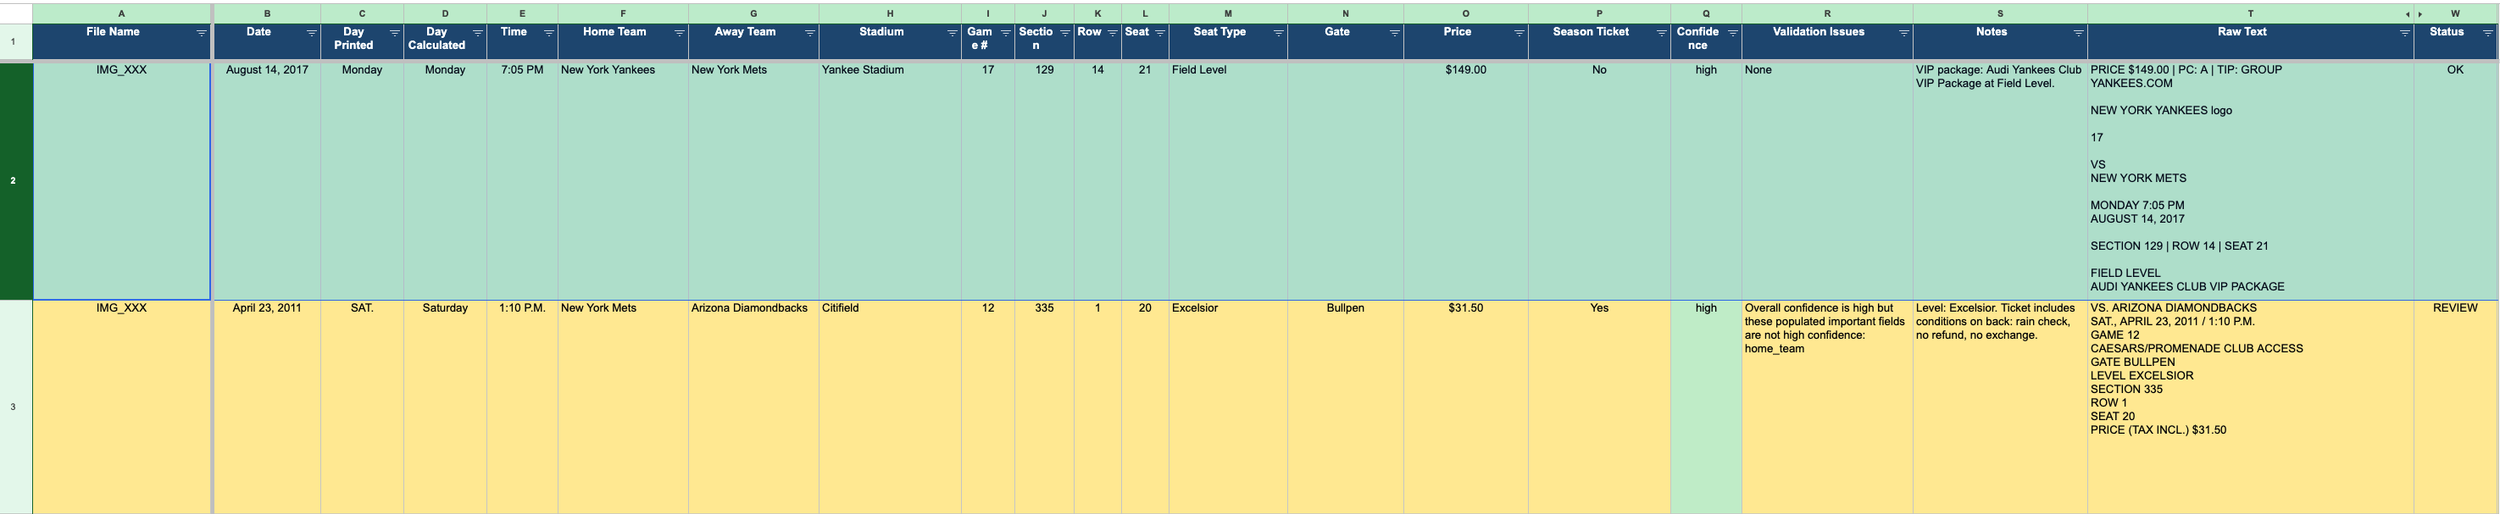
This data set is just the start of my initial exploration. I’ll eventually export this information to a database so I can join the data with other public datasets such as Retrosheet and Lehman Baseball Database. Some other ideas I’ve played with:
Chart playoff contention across games I’ve attended each year: Yearly attendance skewed heavily toward the summer, with lighter attendance at the beginning and end of the season. What did playoff contention look like at each point when I attended?
Total win-loss records for games I attended during each season: Maybe I’m a good luck charm…or maybe I help bring the heartbreak.
Building heatmaps of where I’ve sat in stadiums: This would really be the most prominent in Shea Stadium, Citi Field, and Yankee Stadium.
What’s Next
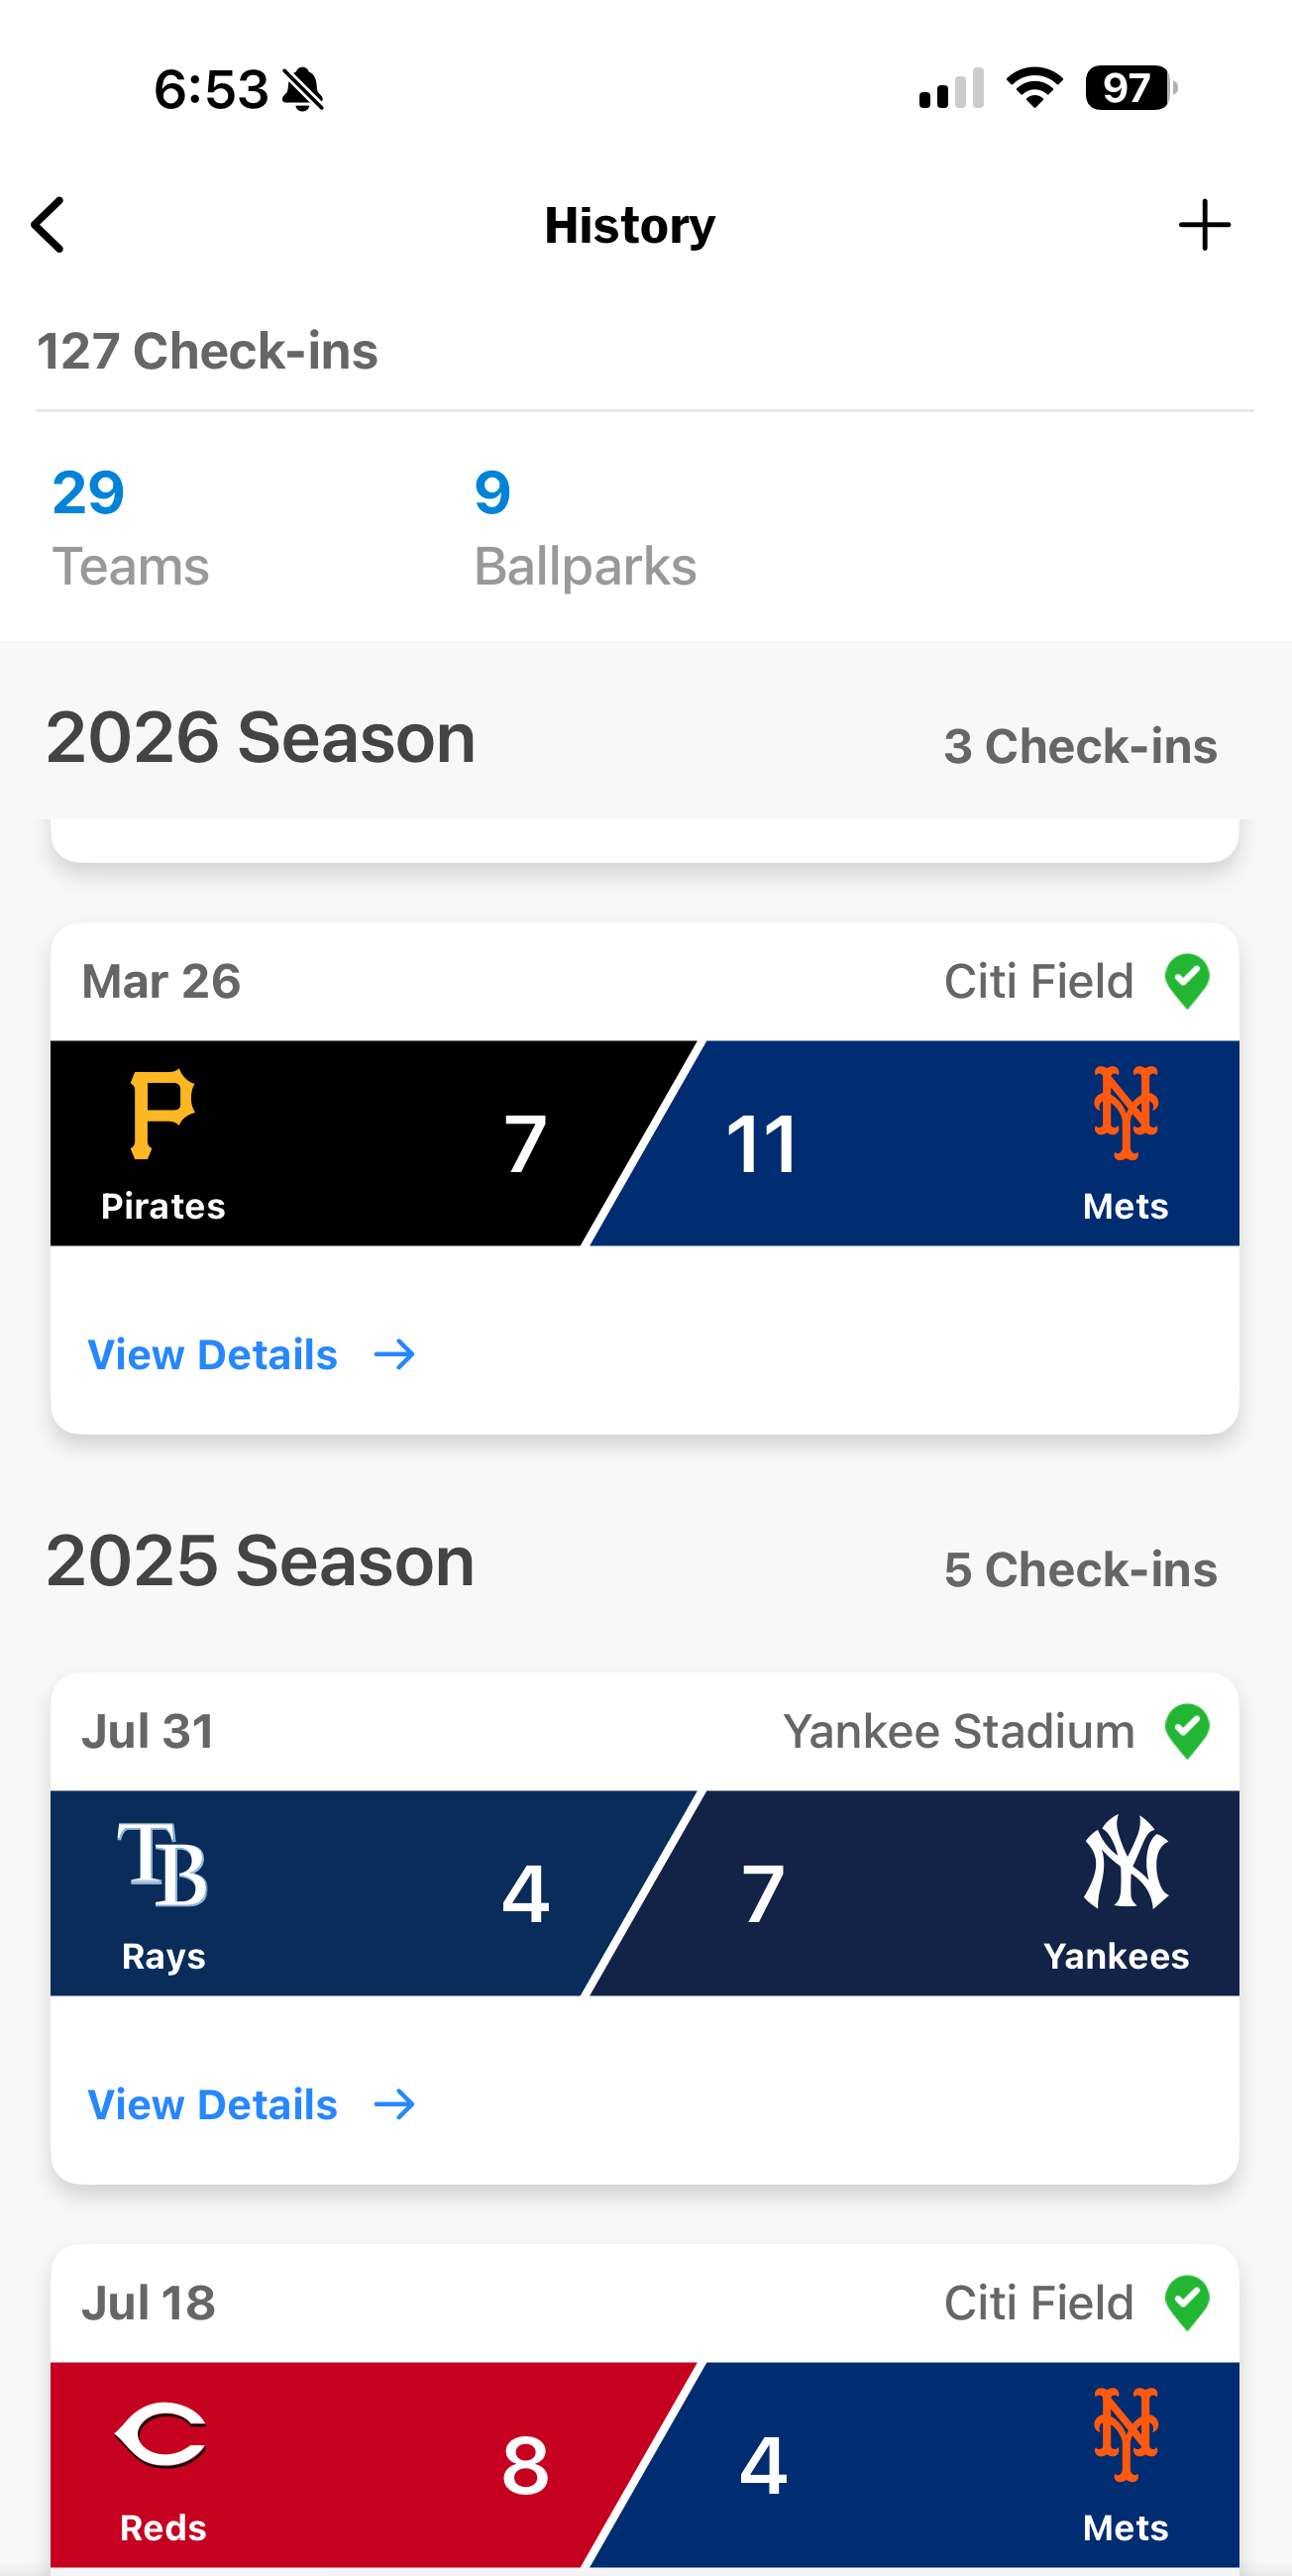
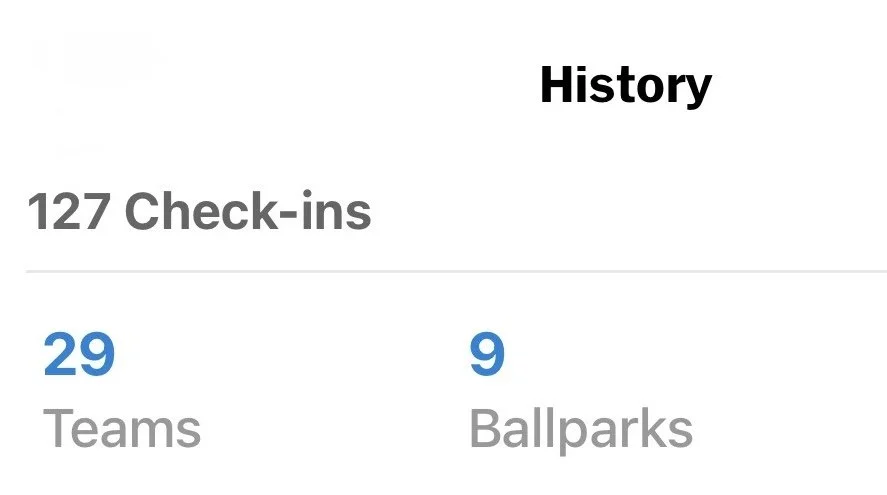
This is only the start of quantifying my baseball journey. As I mentioned at the beginning, I estimate attending more than two-hundred games. With the switch to digital only tickets in the late 2000’s, I have one-hundred twenty seven digital tickets in the MLB Ballpark app and from what I can tell, no public API to pull them programmatically. There’s probably some overlap since the MLB Ballpark application automatically checks you in when you when you open it near a stadium but I’m excited to find out. I’ve got some ideas on how to extract that information but I’ll save that for another blog post.
The Power of Personal Context
Working through this project was really fun. I’ve always been good about documenting, note taking, or using photography to capture experiences throughout my life. While I was able to leverage some of it for this specific post, I’ve created personal context that I can use for other projects with Claude and agents. Daniel Miessler has talked extensively about building assistants to organize and collect knowledge and this will be just one piece of personal context that I can use to help enrich understanding, extract long forgotten wisdom, and more.